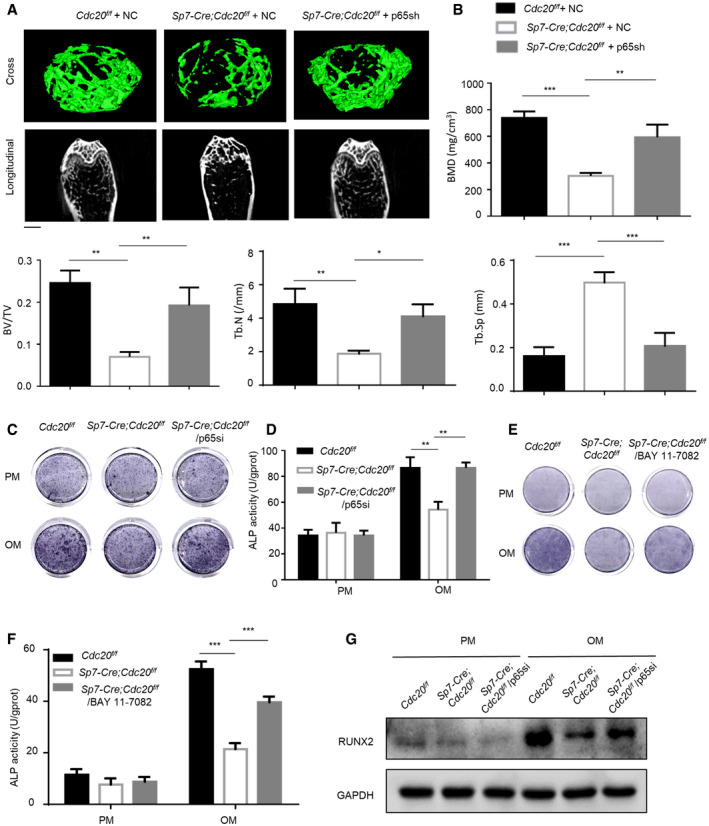
Figure 8. CDC20 regulated osteogenic differentiation of BMSCs in a p65‐dependent manner.

-
ARepresentative micro‐CT images of trabecular bone from the femoral metaphysis of Cdc20f / f with negative control lentivirus, Sp7‐Cre;Cdc20f / f with negative control lentivirus, and Sp7‐Cre;Cdc20f / f with p65sh lentivirus. Scale bar, 500 μm.
-
BHistomorphometric analyses of Cdc20f / f with negative control lentivirus, Sp7‐Cre;Cdc20f / f with negative control lentivirus, and Sp7‐Cre;Cdc20f / f with p65sh lentivirus (n = 6).
-
C, DThe ALP staining (C) and ALP quantification (D) of BMSCs from Cdc20f / f mice and Sp7‐Cre;Cdc20f / f mice after 7 days osteogenic differentiation treated with negative control or p65si (n = 5).
-
E, FThe ALP staining (E) and ALP quantification (F) of BMSCs from Cdc20f / f and Sp7‐Cre;Cdc20f / f mice after 7 days osteogenic differentiation treated with BAY 11‐7082 (NF‐κB pathway inhibitor) (n = 5).
-
GThe expression of RUNX2 in BMSCs from Cdc20f / f mice and Sp7‐Cre;Cdc20f / f mice after 7 days osteogenic differentiation treated with negative control or p65si by Western blot analyses.
Data information: Data are displayed as mean ± SD and show one representative of n ≥ 3 independent experiments with three biological replicates. Statistical significance was calculated by one‐way ANOVA followed by a Tukey’s post hoc test and defined as *P < 0.05; **P < 0.01; ***P < 0.001.
