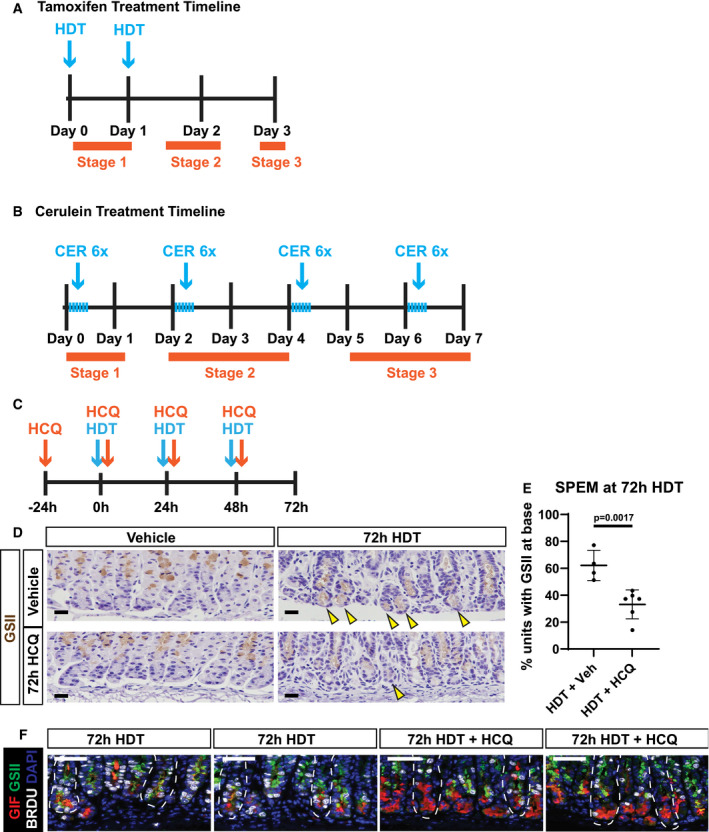
Scheme of tamoxifen treatment timeline. Mice were administered high‐dose tamoxifen (HDT; 5 mg/20 g body weight) by intraperitoneal injection up to two times, and stomachs were harvested at the respective/indicated timepoint as per the experimental details. Day 3 of timeline is when peak SPEM is observed. Orange bars indicate each stage of paligenosis and where they correspond in the treatment timeline.
Scheme of cerulein (CER) treatment timeline to induce pancreatitis. Mice were administered repeated cerulein injections by intraperitoneal injection. Six hourly injections of cerulein (50 μg/kg) were given every other day for up to 7 days (peak ADM). Orange bars indicate each stage of paligenosis and where they correspond in the treatment timeline.
Scheme of hydroxychloroquine (HCQ) treatment timeline. Mice were pretreated with 60 mg/kg HCQ (or PBS) one day prior to high‐dose tamoxifen (HDT) administration alongside HCQ (60 mg/kg/day). Stomachs were harvested at day 3 (72 h) when peak SPEM is normally observed.
Immunohistochemistry for GSII in gastric units to mark normal mucous neck cells (vehicle) and SPEM cells (72‐h HDT) in mice treated with vehicle, HDT, HCQ, or HDT + HCQ. Scale bars 20 µm. Counterstained with hematoxylin. Arrows mark GSII at the base of the stomach unit indicating SPEM.
Quantification of the fraction of gastric units exhibiting SPEM (from EV1D). Each data point = mean of counts from 40 to 50 gastric glands from an individual mouse, n = 4–6 mice per treatment group; black line = mean of means from each mouse ± SEM. Significance by nonparametric two‐tailed t‐test.
Immunofluorescence of gastric units; nuclei (DAPI, blue), chief cells (GIF, red), progenitor/metaplastic cells (GSII green + red GIF), and proliferative cells (BrdU, white) after treatment with HDT or HDT + HCQ for 72 h. 72‐h HDT units exhibit SPEM (GSII and GIF overlap), while 72‐h HDT+HCQ units show scant SPEM and full chief cell cytoplasm packed with GIF secretory granules. Scale bars 50 µm. Stomach unit base outlined by dashed white line.