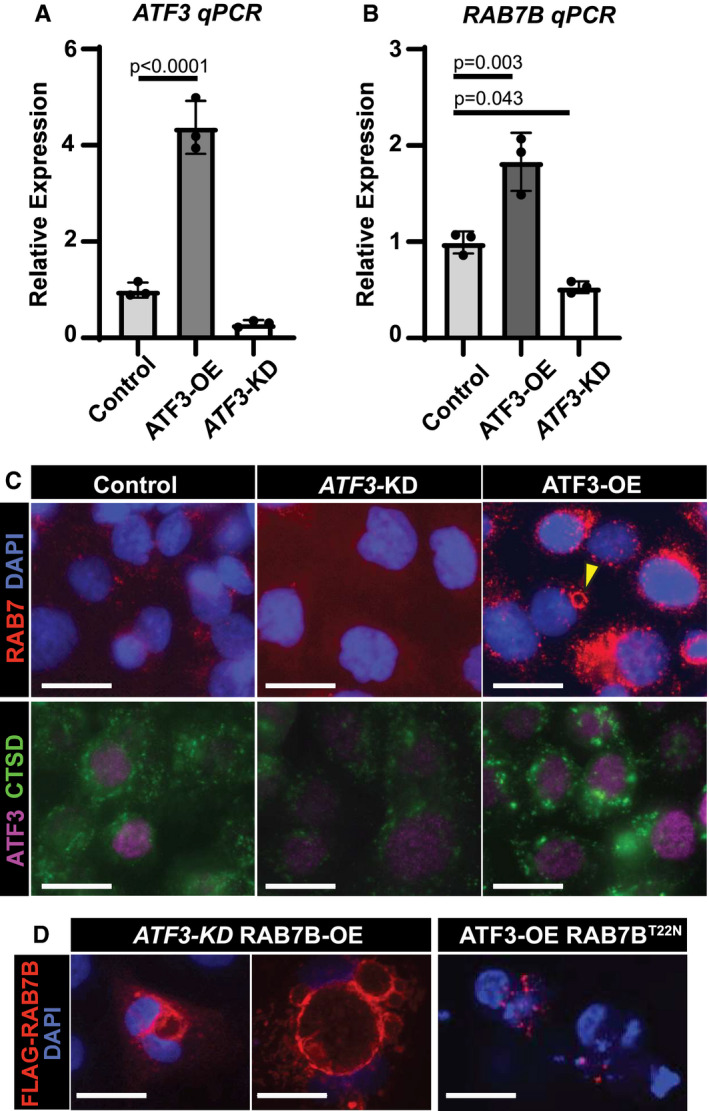
mRNA expression of ATF3 by qRT–PCR in control, ATF3 knockdown (KD), and ATF3 overexpression (OE) AGS cell lines generated using a PiggybacTM transposon system. Significance by one‐way ANOVA, Dunnett post‐hoc. Data point = mean of technical triplicates in a single mouse. n = 3 mice. Error bars denote standard deviation.
mRNA expression of RAB7B by qRT–PCR in AGS cell lines from 3A. Statistics and plotting as for panel A.
Top—Immunofluorescence for RAB7 (red) and DAPI (blue, nuclei) in control, ATF3 knockdown (KD), and ATF3 overexpression (OE) AGS cells. Arrowhead indicates aggregated RAB7 vesicular formation similar to those observed in tissue. Bottom—Immunofluorescence for ATF3 (purple) and cathepsin D (CTSD, green, lysosomes) in AGS cells. Scale bar, 20 µm.
Left—Immunofluorescence for anti‐FLAG (RAB7B) (red) and DAPI (blue, nuclei) in ATF3 knockdown; RAB7B overexpression (ATF3‐KD RAB7B‐OE) AGS cells show large vesicular structures. Right—Immunofluorescence for anti‐FLAG (RAB7B) (red) and DAPI (blue, nuclei) in ATF3 overexpression; RAB7B GTPase mutant (ATF3‐OE RAB7BT22N) AGS cells fail to make vesicles. Scale bar, 20 µm.

