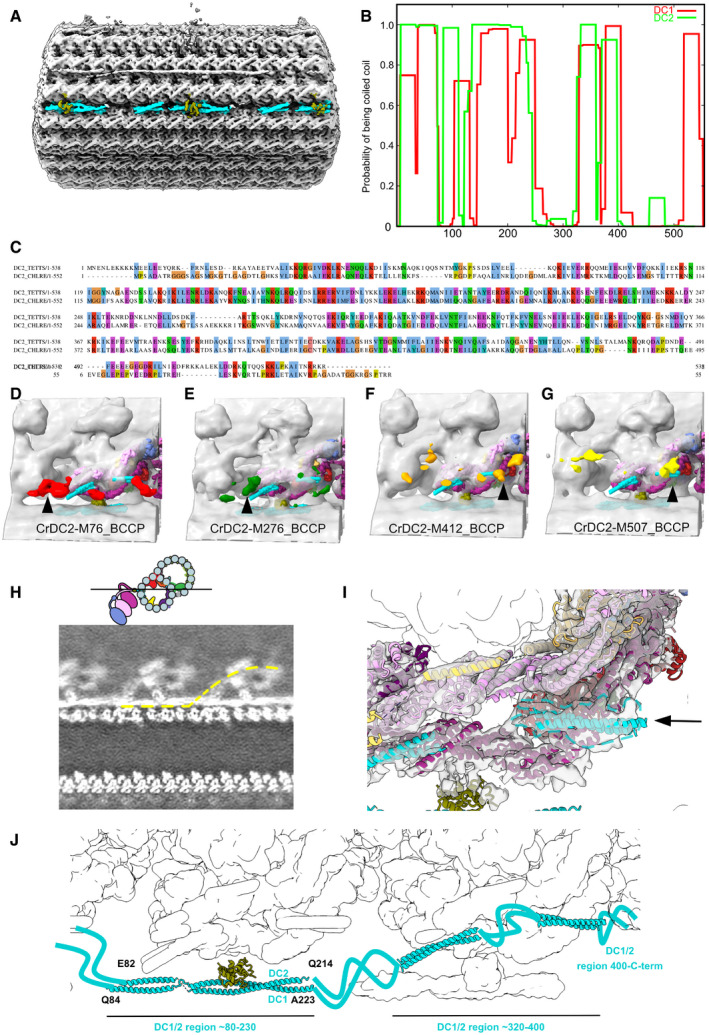
Figure EV4. Modeling of the docking complex.

-
AThe DC density on the doublet microtubule between PFs‐A7 and A8.
-
BPrediction of coiled coil for DC1 and DC2 using COILS with a window size of 28 (Lupas et al, 1991).
-
CSequence alignment of Chlamydomonas DC1 and Tetrahymena CCDC151 homolog (Q22T00).
-
D–GStructures of Chlamydomonas ODA reconstituted on microtubules with biotin carboxyl carrier protein (BCCP) tagged in different regions of DC2 (residue 76, 276, 412, and 507) from Oda et al (2016a) (EMD‐6508, 6509, 6510, 6511). The enhanced signals of BCCP‐tag are indicated in colors.
-
HSlice from a density map showing the docking complex (position indicated in the cartoon). The yellow line indicates one continuous DC1/2.
-
IThe globular density at the end of the coiled coil of DC1/2 (black arrow and dotted line).
-
JThe model of the DC based on our analysis.
