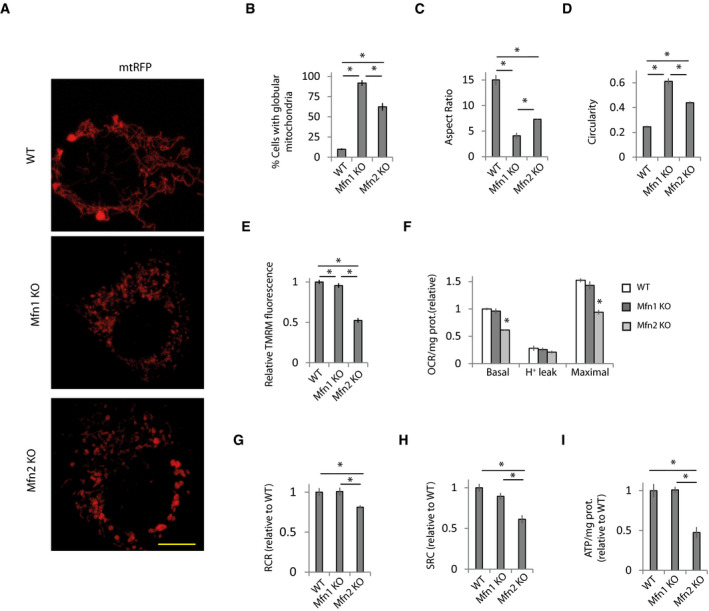
Figure 1. Defects in mitochondrial bioenergetics in Mfn2 KO cells do not depend on mitochondrial morphology.

-
A–D(A) Representative images of WT, Mfn1 KO, and Mfn2 KO MEFs transfected for 48 h with a plasmid encoding mitochondria‐targeted RFP (mt‐RFP). Scale bar: 5 µm. (B) Percentage of cells displaying globular mitochondria (n = 310–668 cells analyzed in 3–6 independent experiments). Data are presented as mean ± SEM. (C) Analysis of aspect ratio (AR) calculated as major axis/minor axis and (D) circularity calculated as 4*π*Area/Perimeter2 (n = 300 mitochondria in three independent experiments). Data are presented as mean ± SEM.
-
EMitochondrial membrane potential (MMP) was determined by measuring TMRM fluorescence (n = 90 cells analyzed in three independent experiments). Data are presented as mean ± SEM.
-
F–H(F) Oxygen consumption rate (OCR) normalized to the amount of protein in WT, Mfn1 KO, and Mfn2 KO fibroblasts. Proton leak was measured after application of oligomycin (1 µM), maximal after CCCP application (10 µM), and oligomycin (n = 3 independent experiments). Data are presented as mean ± SEM. (G) Respiratory control ratio (RCR) was calculated as maximal oxygen consumption rate (OCR)/H+ leak OCR (n = 3 independent experiments). Data are presented as mean ± SEM. (H) Spare respiratory capacity was calculated as maximal OCR‐basal OCR (n = 3 independent experiments). Data are presented as mean ± SEM.
-
IWT MEFs and Mfn1 or Mfn2 KO MEFs were incubated with 2‐DG (10 mM) for 6 h, and ATP levels were measured (n = 3 independent experiments). Data are presented as mean ± SEM.
Data information: *P < 0.05, one‐way ANOVA followed by Tukey’s post hoc test.
