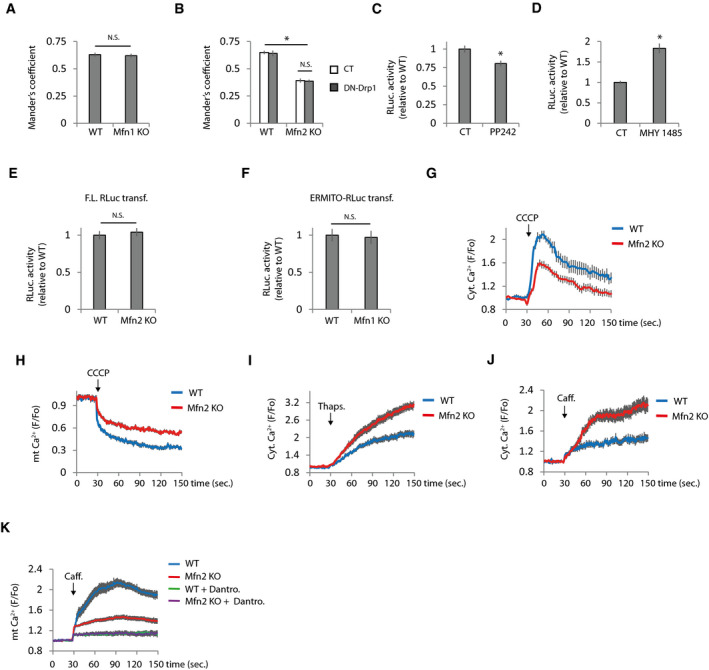
Figure EV2. ER and mitochondrial Ca2+ levels are deregulated in Mfn2 KO cells.

-
AMander’s coefficient of WT and Mfn1 KO cells co‐transfected with plasmids encoding mitochondria‐targeted RFP and ER‐targeted GFP (n = 15 cells analyzed in three independent experiments). Data are presented as mean ± SEM.
-
BRestoration of mitochondrial morphology does not restores ER‐mitochondria colocalization. Mander’s coefficient of WT and Mfn2 KO cells co‐transfected with plasmids encoding mitochondria‐targeted RFP and ER‐targeted GFP and the indicated plasmids (n = 15 cells analyzed in three independent experiments). Data are presented as mean ± SEM.
-
C, DERMITO‐Luc detects changes in ER‐mitochondria contacts induced by manipulation of mTOR pathway. RLuc activity in cells transfected with ERMITO‐Luc and treated with (C) the mTOR inhibitor PP242 (25 µM) (n = 4 independent experiments) or (D) the mTOR activator MHY 1485 (10 µM) (n = 6 independent experiments). Data are presented as mean ± SEM.
-
EThere are not differences in the RLuc activity in the WT and Mfn2 KO cells transfected with plasmid expressing full‐length Renilla Luciferase driven by the CMV promoter (n = 3 independent experiments). Data are presented as mean ± SEM.
-
FRLuc activity in WT and Mfn1 KO cells transfected with ERMITO‐Luc (n = 3 independent experiments). Data are presented as mean ± SEM.
-
G, HDiminished Ca2+ levels in Mfn2 KO mitochondria. (G) Mitochondrial Ca2+ was released from mitochondria by applying CCCP (10 µM), and the rise in cytoplasmic Ca2+ was analyzed with Fluo‐4 (n = 30 cells analyzed from three independent experiments). (H) Analysis of mitochondria Ca2+ levels in WT, and Mfn2 KO cells were transfected with the mitochondria‐targeted Ca2+ sensor mt‐Cepia (n = 30 cells from three independent experiments). Data are presented as mean ± SEM.
-
IIncreased ER Ca2+ levels in Mfn2 KO cells analyzed by measuring cytoplasmic Ca2+ rise with Fluo‐4 after thapsigargin (1 µM) treatment (n = 30 cells from three independent experiments). Data are presented as mean ± SEM.
-
JCaffeine induces higher ER Ca2+ release to the cytoplasm in Mfn2 KO cells. ER Ca2+ release was stimulated with caffeine (20 mM) as indicated, and cytoplasmic Ca2+ levels were analyzed with Fluo‐4 (n = 30 cells from three independent experiments). Data are presented as mean ± SEM.
-
KThe source of Ca2+ after caffeine treatment is from de ER. Inhibition of the RyR with dantrolene (10 µM) prevents caffeine‐induced increase in mitochondrial Ca2+ levels (n = 30 cells from three independent experiments). Data are presented as mean ± SEM.
Data information: *P < 0.05, one‐way ANOVA followed by Tukey’s post hoc test.
