
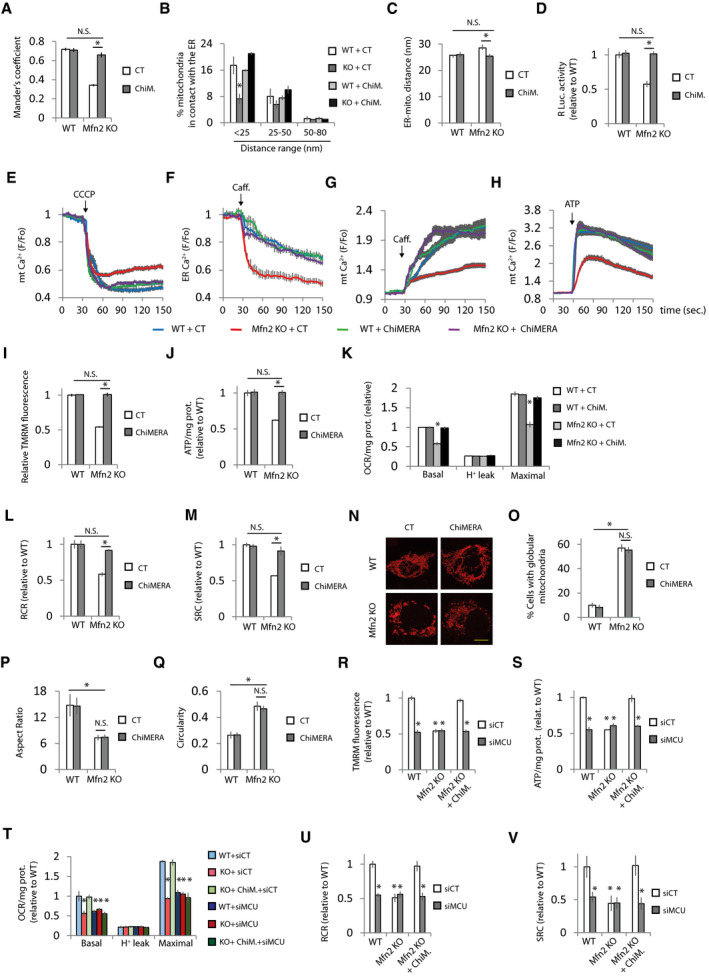
Figure 3. Artificial ER‐mitochondria tethering corrects Ca2+ homeostasis and bioenergetics defects in Mfn2 KO cells.
WT and Mfn2 KO cells were transfected with plasmids encoding:
-
Amt‐RFP, ER‐GFP, and ChIMERA or control (CT). ER‐mitochondria colocalization was analyzed using Mander’s coefficient (n = 15 cells analyzed in three independent experiments). Data are presented as mean ± SEM.
-
B, CGFP and ChiMERA or control (CT). After 24 h, the transfected cells were sorted and plated for another 24 h, after which were processed for EM. (B) Quantification of the percentage of mitochondria in contact with the ER distributed at the indicated distance range (n = 3 independent experiments in which were analyzed 598–779 mitochondria from 68 to 98 cells). *P < 0.05, one‐way ANOVA followed by Tukey’s post hoc test. (C) Average of ER‐mitochondria distance (n = 111–193 mitochondria). Data are presented as mean ± SEM. *P < 0.05, Kruskal‐Wallis test followed by Dunn’s post hoc test.
-
DGFP, ERMITO‐Rluc, and ChiMERA or control plasmid. After 24 h, the transfected cells were sorted and plated for another 24 h, after which RLuc was analyzed (n = 3 independent experiments). Data are presented as mean ± SEM.
-
EGFP and ChiMERA or control (CT) plasmid. Mitochondrial Ca2+ was determined. Mitochondria were uncoupled with CCCP (10 µM) as indicated (n = 30 cells from 4 independent experiments). Data are presented as mean ± SEM.
-
FLAR‐GECO1 and ChiMERA or control (CT) plasmid. ER Ca2+ was determined. ER Ca2+ release was induced with caffeine (20 mM) as indicated (n = 30 cells from 3 independent experiments). Data are presented as mean ± SEM.
-
GGFP and ChiMERA or control (CT) plasmid. The effect of caffeine‐induced (20 mM) ER Ca2+ release on mitochondrial Ca2+ was measured (n = 30 cells from three independent experiments). Data are presented as mean ± SEM.
-
HGFP and ChiMERA or control (CT) plasmids. The effect of ATP‐induced (100 µM) ER Ca2+ release on mitochondrial Ca2+ was measured (n = 30 cells from three independent experiments). Data are presented as mean ± SEM.
-
IGFP and ChiMERA or control plasmid. MMP was determined. The values were normalized to surrounding untransfected cells (n = 90 cells analyzed in three independent experiments). Data are presented as mean ± SEM.
-
JGFP and ChiMERA or control plasmid. After 24 h, the transfected cells were sorted and plated for another 24 h, after which cells were treated with 2‐DG (10 mM) for 6 h, and ATP levels were measured (n = 3 independent experiments). Data are presented as mean ± SEM.
-
K–MGFP and ChiMERA or control plasmid. After 24 h, the transfected cells were sorted and plated for another 24 h, when (K) oxygen consumption was measured and (L) RCR and (M) SRC were calculated (n = 4 independent experiments). Data are presented as mean ± SEM.
-
N–Qmt‐RFP and ChiMERA or control plasmid, and after 48 h, they were fixed. N) Representative images. Scale bar = 5 µm. (O) The percentage of globular mitochondria (n = 175–408 cells analyzed in three independent experiments), (P) aspect ratio, and (Q) circularity were calculated (n = 300 mitochondria analyzed in three independent experiments). Data are presented as mean ± SEM.
-
R–VGFP and the indicated combination of non‐targeting siRNA (siCT), siRNA targeting MCU (siMCU), ChiMERA, or control (indicated as WT or Mfn2 alone) plasmids. (R) MMP was analyzed (n = 90 cells analyzed in three independent experiments). (S) ATP levels of GFP+ cells was analyzed after 24 h treatment with 2‐DG (10 mM) (n = 3 independent experiments). (T) OCR was analyzed and (U) cell respiratory control ration and (V) spare respiratory capacity were calculated (n = 3 independent experiments). Data are presented as mean ± SEM.
Data information: *P < 0.05, one‐way ANOVA followed by Tukey’s post hoc test. Note that experiments in Figs 2D and 3C, 2E and 3B, 3G and 4I, 3J and 4K, 3K and 4L, 3L and 4M, and 3M and 4N were performed at the same time, so the values of WT and Mfn2 KO transfected with control plasmid are the same but the figures have been split in two for the sake of linearity.