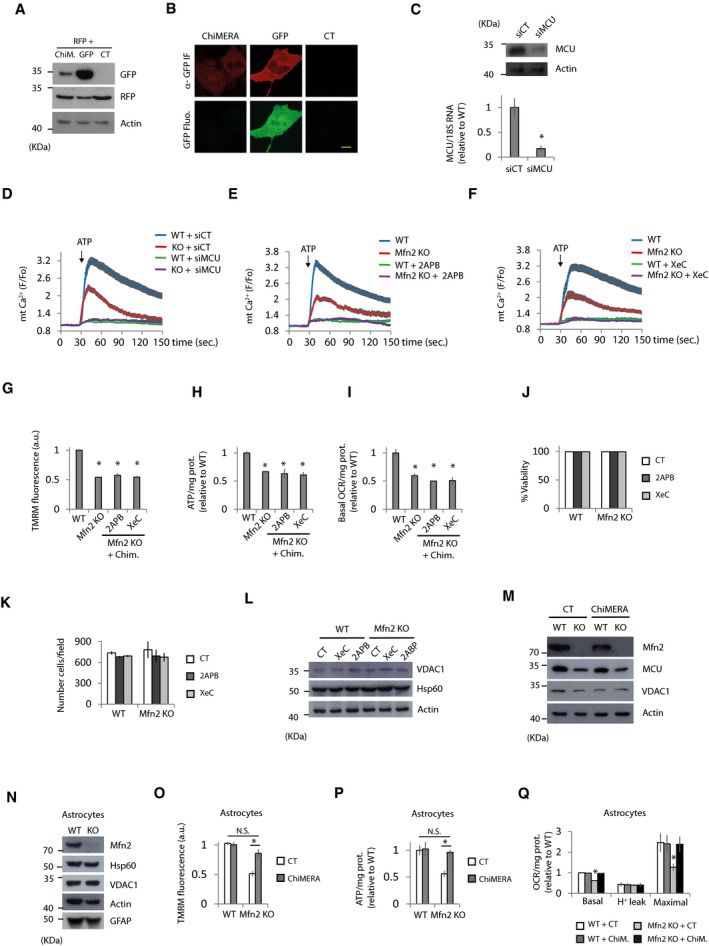
Figure EV3. Restoration of bioenergetics defects in Mfn2 KO cells require proper Ca2+ transfer from the ER to mitochondria.

-
A, BChiMERA is weakly expressed in MEFs. (A) Representative Western blots of the indicated proteins in Mfn2 KO fibroblasts transfected with RFP plus ChiMERA, GFP, or control (CT) plasmids as indicated (n = 3 independent experiments). Data are presented as mean ± SEM. (B) Representative confocal images of Mfn2 KO transfected cells with ChIMERA or GFP. Green fluorescent signal cannot be observed in ChIMERA expressing cells, although GFP molecule can be detected by three‐step immunofluorescence using antibodies anti‐GFP. Scale bar = 10 µm.
-
CMCU mRNA and protein levels were analyzed by qPCR and Western blot, respectively, of MEFs transfected with siRNA control (siCT) or a pool of 4 siRNAs targeting MCU (siMCU) (n = 3 independent experiments).
-
DMCU KD (siMCU) abolish mitochondrial Ca2+ uptake when the IP3R is stimulated with ATP (100 µM). WT and Mfn2 KO cells were transfected with siRNA control (siCT) or targeting MCU (siMCU). Mitochondrial Ca2+ uptake was analyzed. (n = 28–30 cells from three independent experiments). Data are presented as mean ± SEM.
-
E, FInhibition of IP3R with (E) 2APB (50 µM) or (F) xestospongin C (XeC) (1.5 µM) prevents mitochondrial Ca2+ uptake caused by ATP treatment (n = 30 cells from three independent experiments). Data are presented as mean ± SEM.
-
G–ITreatment with 2APB or XeC prevents ChiMERA‐mediated rescue of (G) MMP (n = 90 cells analyzed in three independent experiments), (H) ATP levels (n = 3 independent experiments), and (I) basal oxygen consumption rate (n = 3 independent experiments) in Mfn2 KO cells. Data are presented as mean ± SEM.
-
J, K2APB or XeC treatment does not affect cell viability. WT and Mfn2 KO MEFs were treated with XeC (1.5 µM) or 2APB (50 µM) for 16 h, and then cell viability (J) was analyzed by fixing cells, DAPI staining and counting non‐pyknotic nuclei as percentage of the total number of nuclei (n = 3 independent experiments). (K) Total number of nuclei per field was counted (n = 3 independent experiments). Data are presented as mean ± SEM.
-
LMitochondrial mass is not affected by 2APB or XeC treatment. Representative Western blot of the indicated proteins of WT and Mfn2 KO MEFs treated for 16 h with XeC (1.5 µM), 2APB (50 µM) or vehicle (CT) (n = 3 independent experiments).
-
MMfn2 KO show diminished expression levels of MCU but this is not rescued by ChiMERA expression. WT and Mfn2 KO cells were transfected with RFP and ChiMERA or control plasmid. After 24 h, the transfected cells were sorted and plated for another 24 h, when protein extracts were obtained. Representative Western blot of the indicated proteins (n = 3 independent experiments).
-
NWestern blot with the indicated antibodies to characterize cultures of tamoxifen‐inducible Mfn2 KO astrocyte cultures (n = 3 independent experiments).
-
O–QBioenergetic parameters were analyzed in WT and Mfn2 KO astrocytes transfected with ChiMERA or control plasmid. (O) MMP (n = 30 cells from three independent cultures). (P) Analysis of ATP levels after 6 h treatment with 2‐DG (10 mM) (n = 3 independent experiments). (Q) Oxygen consumption rates. Proton leak was measured after application of oligomycin (1 µM), maximal after CCCP application (10 µM), and oligomycin (n = 5 independent experiments). Data are presented as mean ± SEM.
Data information: *P < 0.05, one‐way ANOVA followed by Tukey’s post hoc test except (C) that was used two‐tailed Student’s t‐test.
