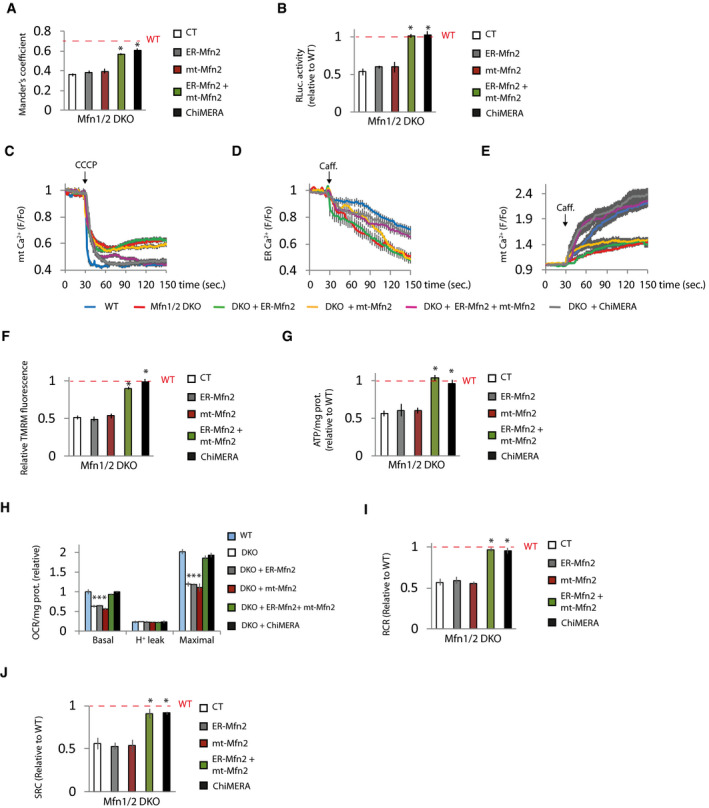
Figure 5. ER‐located Mfn2 and mitochondrial Mfns are necessary to maintain mitochondrial bioenergetics.

-
Amt‐RFP, ER‐GFP, and plasmids expressing the indicated proteins. Mitochondria‐ER colocalization was analyzed using Mander’s coefficient (n = 15 cells analyzed in three independent experiments). Data are presented as mean ± SEM.
-
BGFP and ERMITO‐RLuc and indicated expression vectors. After 24 h, the transfected cells were sorted and plated for another 24 h, after which RLuc was analyzed (n = 3 independent experiments). Data are presented as mean ± SEM.
-
CGFP and the indicated plasmids. After 48 h, mitochondrial Ca2+ was determined (n = 30 cells from 3 independent experiments). Data are presented as mean ± SEM.
-
DLAR‐GECO1 and the indicated plasmids. After 48 h ER Ca2+ was released with caffeine (20 mM) as indicated (n = 25–27 cells from three independent experiments). Data are presented as mean ± SEM.
-
EGFP and the indicated plasmid. After 48 h, the effect of caffeine‐induced (20 mM) ER Ca2+ release on mitochondrial Ca2+ was measured (n = 25 cells from three independent experiments). Data are presented as mean ± SEM.
-
F–JGFP and the indicated plasmids. (F) After 48 h, mitochondrial membrane potential was determined by measuring TMRM fluorescence. The values were normalized to surrounding untransfected cells. (n = 90 cells analyzed in three independent experiments). (G–I) After 24 h, the transfected cells were sorted and plated for another 24 h. (G) Cells were treated with 2‐DG (10 mM) for 6 h, and ATP levels were measured (n = 3 independent experiments). (H) Oxygen consumption was measured and (I) RCR and (J) SRC were calculated (n = 3 independent experiments). Data are presented as mean ± SEM.
Data information: The red dashed line indicates the WT cells results. *P < 0.05 versus Mfn1/2 DKO cells, one‐way ANOVA followed by Tukey’s post hoc test. Note that experiments in Fig 5A and Appendix Fig S5B, Fig 5C and Appendix Fig S5G, and Fig 5D and Appendix Fig S5H were performed at the same time, so the values of WT and Mfn2 KO transfected with control plasmid are the same but the figures have been split in two for the sake of linearity.
