
Figure EV1. Enriched pathways in C‐EMT.
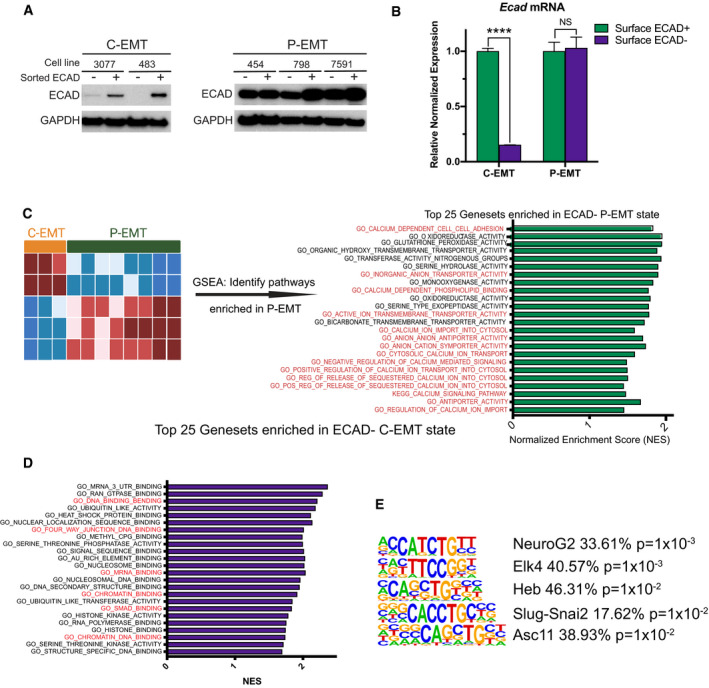
- Western blot comparing ECAD in sorted ECAD+ versus ECAD− cells from two C‐EMT and three P‐EMT murine PDA cell lines.
- qPCR comparing Ecad mRNA in sorted ECAD+ versus ECAD− cells from a P‐EMT (454) and C‐EMT (483) murine PDA cell line. Experiment was performed in triplicate. Statistical analysis by Student’s unpaired t‐test (****P < 0.0001; non‐significant (NS); ± SEM).
- Left: Bioinformatic schematic for GSEA comparing ECAD− versus ECAD+ murine PDA tumor cells in either P‐EMT tumors (n = 8) or C‐EMT (n = 3). Right: GO and KEGG pathways upregulated in P‐EMT tumors. Normalized enrichment score (NES) for the top 25 pathways with a false discovery rate (FDR) < 0.15 are shown, ordered by FDR. Red text indicates pathways of interest.
- Gene ontology (GO) and KEGG pathways upregulated in C‐EMT tumors. NES score for the top 25 pathways with an FDR < 0.15 are shown ordered by FDR value. Red text indicates pathways of interest.
- HOMER Motif analysis comparing C‐EMT ECAD− tumor cells versus C‐EMT ECAD+ tumor cells. The five most enriched pathways shown. Statistical analysis performed in HOMER.
Source data are available online for this figure.