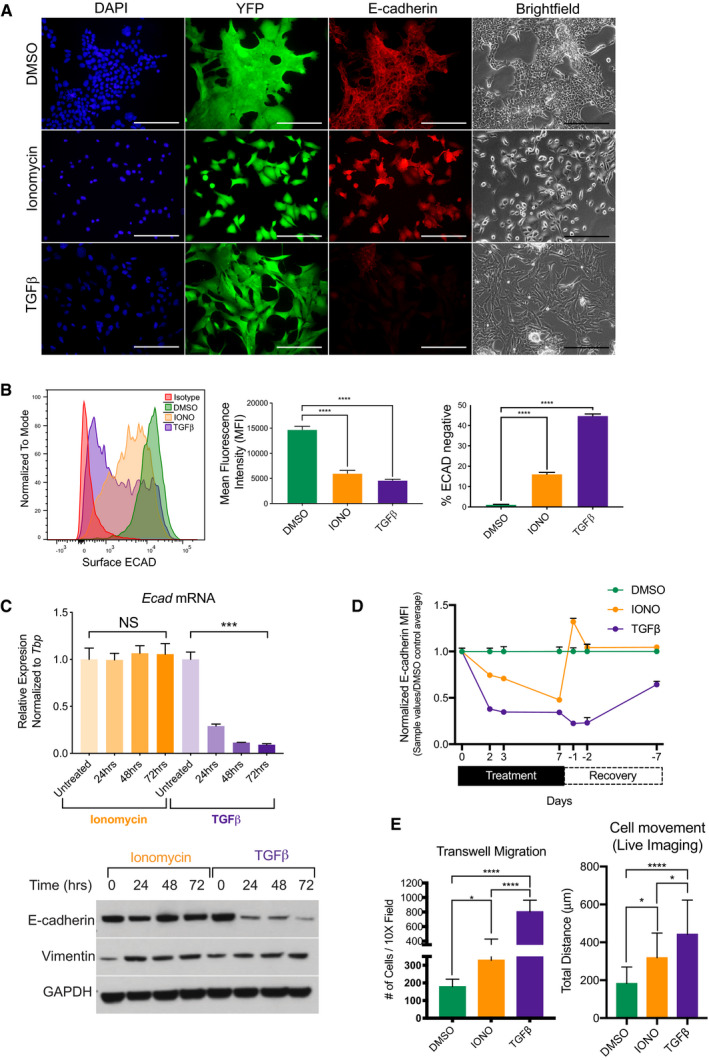
Figure 2. Ca2+ influx is sufficient to drive a P‐EMT phenotype and increased migration and invasion.

- Representative 20× brightfield and fluorescent images of murine YFP+ tumor cells treated for 72 h with vehicle control (DMSO), 2.5 µM ionomycin, or 10 ng/ml TGFβ and co‐stained for E‐cadherin (red) and DAPI (blue). Scale bar is 100 µm.
- Representative flow cytometry analysis of surface ECAD (left), MFI of surface ECAD (middle), and percentage of surface ECAD‐negative cells (right) in murine PDA cells, after treatment with DMSO, 2.5 µM ionomycin (IONO), and 10 ng/ml TGFβ for 72 h. Representative of three independent murine PDA cell lines run in triplicate. Statistical analysis by ANOVA (****P < 0.0001; non‐significant (NS); ±SD).
- Top: Relative mRNA expression of Ecad after treatment with 2.5 µM ionomycin or 10 ng/ml TGFβ for denoted time. Bottom: Western blot analysis of total E‐cadherin and Vimentin protein for denoted time. Experiment was run in duplicate with three different murine PDA cell lines. Statistical analysis by ANOVA (***P < 0.001; non‐significant (NS); ± SEM).
- Normalized MFI of surface E‐cadherin in PDA cells treated with DMSO, 2.5 µM ionomycin (IONO), and 10 ng/ml TGFβ for 7 days, followed by withdrawal of ionomycin or TGFβ for 7 days as indicated on the x‐axis. Treated cells were analyzed at days 2, 3, and 7. Withdrawn cells were analyzed on days 1, 2, and 7. Experiment was performed in duplicate in two different murine PDA cell lines. Error bars indicate SD.
- Quantification of live cellular migration over 4 h after treatment with DMSO, 2.5 µM ionomycin (IONO), or 10 ng/ml TGFβ for 48 h. (n = 16 cells per condition. Experiment was run in triplicate in two murine PDA different cell lines) (Right). Quantification of transwell migration after treatment with DMSO, 2.5 µM ionomycin (IONO), or 10 ng/ml TGFβ for 72 h (n = 2 cell lines, three replicates per cell line with 3 20× images taken per transwell) (left). Statistical analysis by ANOVA (*P < 0.05; ****P < 0.0001; non‐significant (NS); ± SD).
Source data are available online for this figure.
