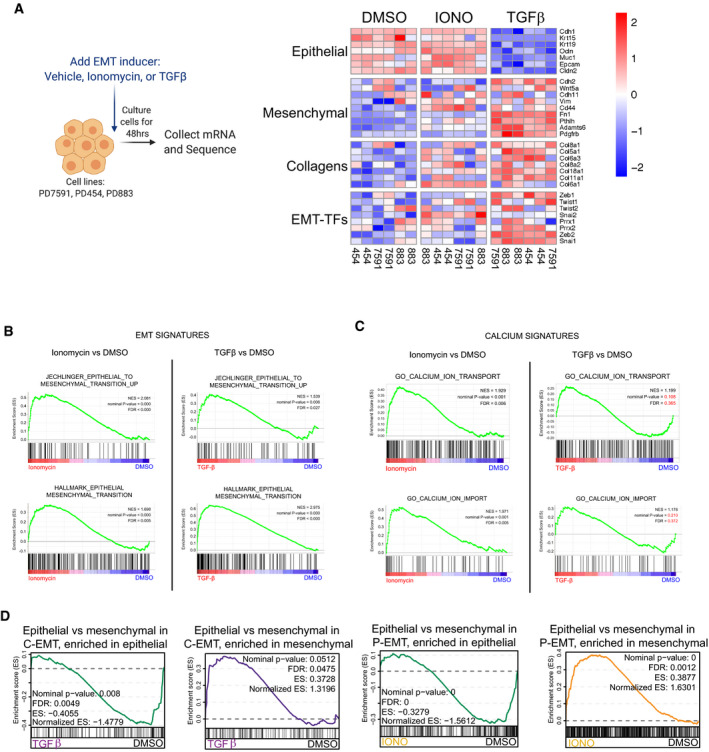
Schematic for RNA‐sequencing after EMT induction for 48 h. Heatmap illustration of EMT‐related genes in three independent murine PDA cell lines, sequenced in duplicate, and treated with DMSO, 2.5 µM ionomycin, or 10 ng/ml TGFβ. Scale indicates Z‐score.
GSEA of ionomycin versus DMSO (left) or TGFβ versus DMSO (right) for EMT signatures. NES, nominal P‐value, and FDR are shown. Statistical analysis performed in GSEA.
GSEA of ionomycin versus DMSO (left) or TGFβ versus DMSO (right) for calcium signatures. NES, nominal P‐value, and FDR are shown. Statistical analysis performed in GSEA.
Leading edge plots showing enrichment of C‐EMT gene signatures in TGFβ‐treated cells (left) or P‐EMT gene signatures in ionomycin (IONO)‐treated cells (right), based on GSEA. Enrichment scores (ES), NES, nominal P‐value, and FDR are shown. Statistical analysis performed in GSEA.

