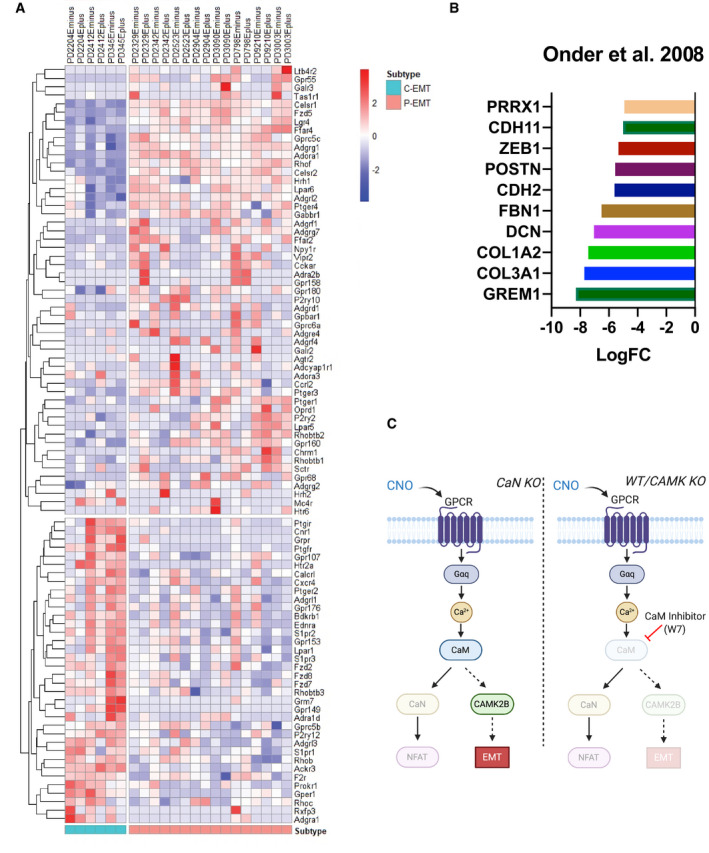
Figure EV5. GPCRs expressed in C‐EMT and P‐EMT pancreatic tumors and a GPCR‐calcium‐calmodulin‐Camk2b signaling axis.

- Heatmap illustrating GPCRs differentially expressed between P‐EMT and C‐EMT murine PDA tumors in vivo. Scale bar indicates Z‐score.
- Re‐analyzed EMT‐related genes upregulated during adherens junction loss from Onder et al, 2008.
- Graphical model illustrating GPCR‐calcium‐calmodulin‐Camk2b signaling axis resulting in P‐EMT.
