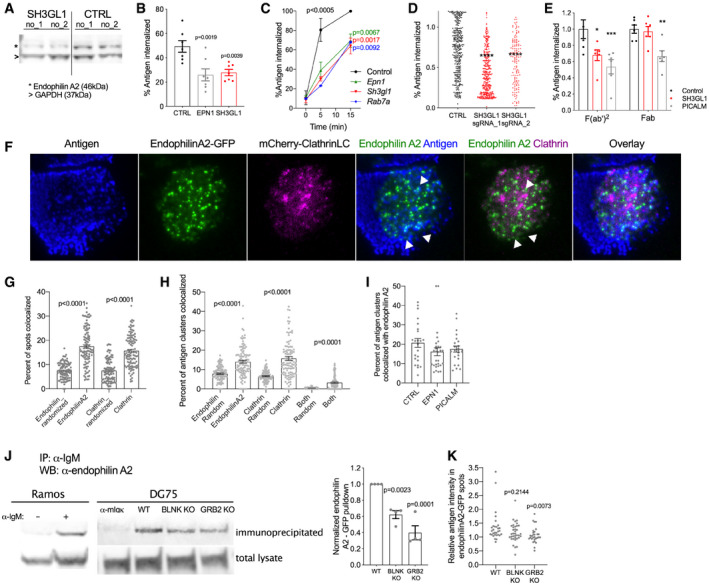
Western blot showing loss of endophilin A2 protein after SH3GL1 targeting in Ramos cells using 2 independent sgRNAs, compared with 2 non‐targeting sgRNAs.
Soluble anti‐IgM F(ab')2 antigen internalization at 20 min in Ramos cells targeted with indicated sgRNAs. P, significance in one‐way ANOVA versus control. Plot shows mean and SEM of 7 independent sgRNA infections.
Validation of gene candidates affecting soluble antigen uptake in primary mouse B cells. Follicular B cells isolated from CRISPR‐targeted bone marrow chimera mice internalize anti‐mouse IgM F(ab')2. Data show mean and SEM of N = 3 mice. P, statistics from 2‐way ANOVA; at 5 min, all 3 genotypes show P < 0.0005 versus control; at 15 min P values are indicated in corresponding color.
Antigen internalization from PMS in SH3GL1‐targeted Ramos cells. ****P < 0.0001 in one‐way ANOVA. N = 547, 389 and 136 cells, respectively, from 2 experiments.
Internalization of soluble Fab or F(ab')2 fragments in Ramos cells targeted with indicated sgRNAs. *P = 0.0124 **P = 0.0092 ***P = 0.0004 using 2‐way ANOVA. Data show mean ± SEM, from 6 biological replicates across two experiments.
TIRF images of Ramos cells transduced with endophilin A2‐GFP and mCherry‐ClathrinLC on antigen‐loaded PMS. Scale bar = 5 μm. White arrowheads highlight endophilin A2 colocalization with antigen clusters. See also Movie
EV1.
Percent of endophilin A2 and clathrinLC spots colocalizing with each other. Levels of random spot colocalization were calculated using randomized spot coordinates. Data show mean and SEM from 107 cells analyzed from 4 experiments; statistics from one‐way ANOVA.
Percentage of surrogate antigen spots colocalizing with endophilin A2, clathrin LC or both markers. Levels of random spot colocalization were calculated using randomized spot coordinates. Data show mean and SEM from 107 cells analyzed from 4 experiments; statistics from one‐way ANOVA.
Colocalization of surrogate antigen clusters with endophilin A2‐GFP following deletion of clathrin adaptors EPN1 or PICALM1. Data show mean and SEM from 23–29 cells.
IgM‐BCR immunoprecipitation to investigate recruitment of endophilin A2 to activated BCRs. Anti‐endophilin A2 blots detect overexpressed endophilin A2‐GFP in streptavidin immunoprecipitates and total supernatants from anti‐IgM‐biotin‐stimulated Ramos and DG75 cells. Representative experiment and quantification from three independent pulldowns in WT, BLNK‐, or GRB2‐knockout (KO) DG75 cells. Pulldown intensity is calculated as a percentage of total endophilin A2 protein and normalized to WT in each experiment. Data show mean and SEM; P values calculated using one‐way ANOVA.
Recruitment of endophilin A2 to antigen clusters quantified as mean antigen intensity in endophilin A2 clusters relative to mean antigen intensity in the entire synapse. N = 30, 29, and 36 cells, respectively, from 2 experiments. P, significance in Kruskal–Wallis test with multiple comparisons.

