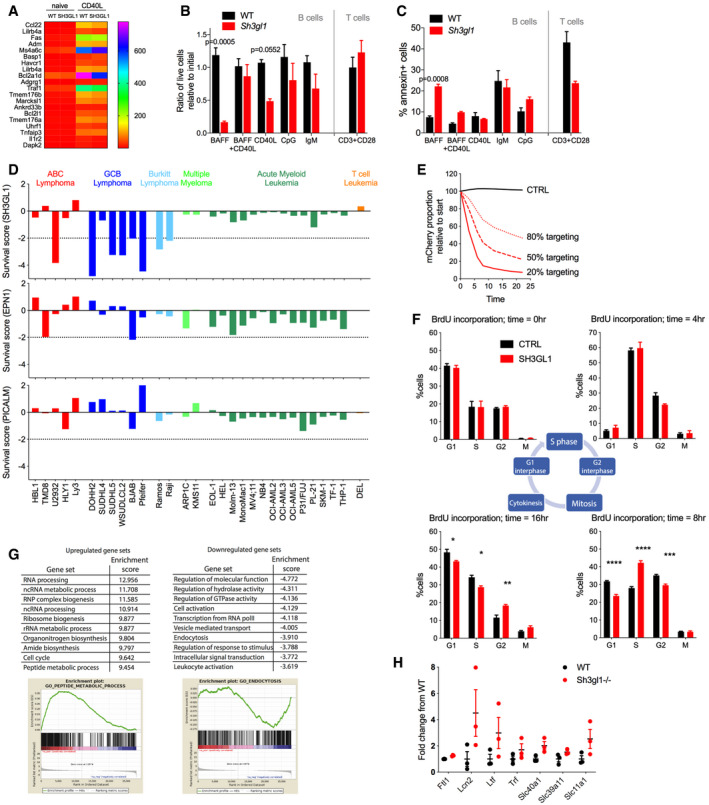
Figure EV4. Loss of endophilin A2 affects cell expansion in primary and Ramos B cells.

- Heat map of TPM values from RNAseq comparing follicular B cells from WT and Sh3gl1 −/− littermates. Shown are the top 20 genes upregulated in WT B cells 24 h after CD40L activation.
- Numbers of viable cells in 3‐day culture of follicular B cells in specified cytokines. N = 3 mice. Data show mean and SEM; P values are calculated using two‐way ANOVA.
- AnnexinV stain of B‐cell cultures in (B). Data show mean and SEM; P values are calculated using two‐way ANOVA.
- Endophilin A2, EPN1, and PICALM survival scores in hematopoietic cell lines from our screens using the Brunello library in Ramos cells, together with CRISPR scores from published genome‐wide screens (Wang et al, 2015; Wang et al, 2017; Phelan et al, 2018). Scores are normalized using the mean value of the top 200 essential genes in each screen. Dotted line indicates typical CRISPR score threshold for gene essentiality.
- Decreased percentage of SH3GL1‐targeted Ramos population in experiments with indicated initial percentage of targeted cells. Data show one representative experiment out of 3.
- BrdU pulse‐chase assay in Ramos cells. Clockwise from top left: equal BrdU incorporation at time = 0 h; slower progression of BrdU‐labeled cells into G2 phase in SH3GL1‐ compared with CTRL‐targeted cells at time = 4 h; slower progression into G1 of following cycle while greater proportion of SH3GL1 cells remain in initial S phase at time = 8 h; slower progression between G2 and M phase in SH3GL1‐targeted cells resulting in significantly greater numbers in G2 and less in G1 or S phase of subsequent cycle. N = 4 independent infections. Data show mean + SEM. *P ≤ 0.05 **P ≤ 0.01 ***P ≤ 0.001 ****P ≤ 0.0001 using 2‐way ANOVA with multiple comparisons.
- GSEA of RNAseq analysis comparing WT and Sh3gl1 −/− sorted follicular B cells. Three mice of each genotype were used for RNAseq and top 10 significantly enriched gene sets up‐ or down‐regulated in Sh3gl1 −/− B cells are shown.
- Expression of genes upregulated in Sh3gl1 −/− B cells in GO: 0006879 cellular_iron_ion_homeostasis. N = 3 mice. Data show mean ± SEM.
