Figure 5.

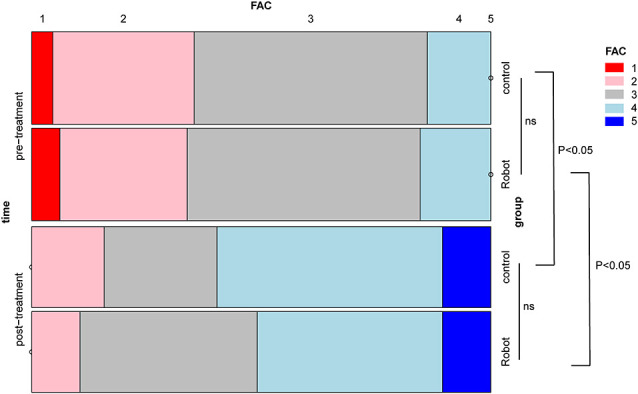
A mosaic plot showing the differences in functional ambulation scale (FAC) scores within the group and between groups. ns: not significant.

A mosaic plot showing the differences in functional ambulation scale (FAC) scores within the group and between groups. ns: not significant.