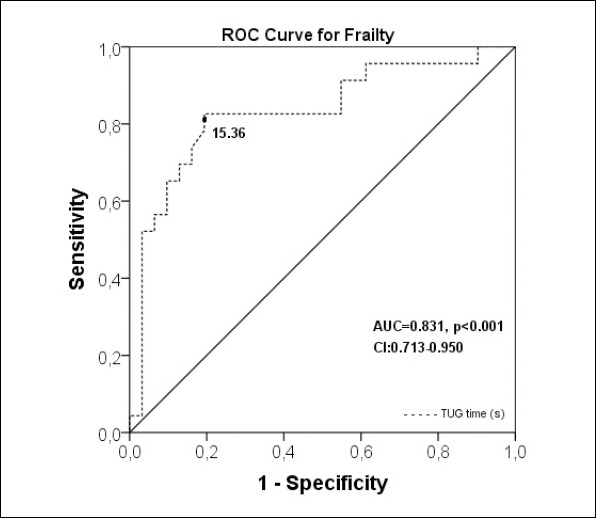
Figure 2.

ROC curve to predict the optimal cut off of Timed Up and Go test in seconds for discrimination of frailty with an area under the ROC curve.

ROC curve to predict the optimal cut off of Timed Up and Go test in seconds for discrimination of frailty with an area under the ROC curve.