
FIGURE 2.
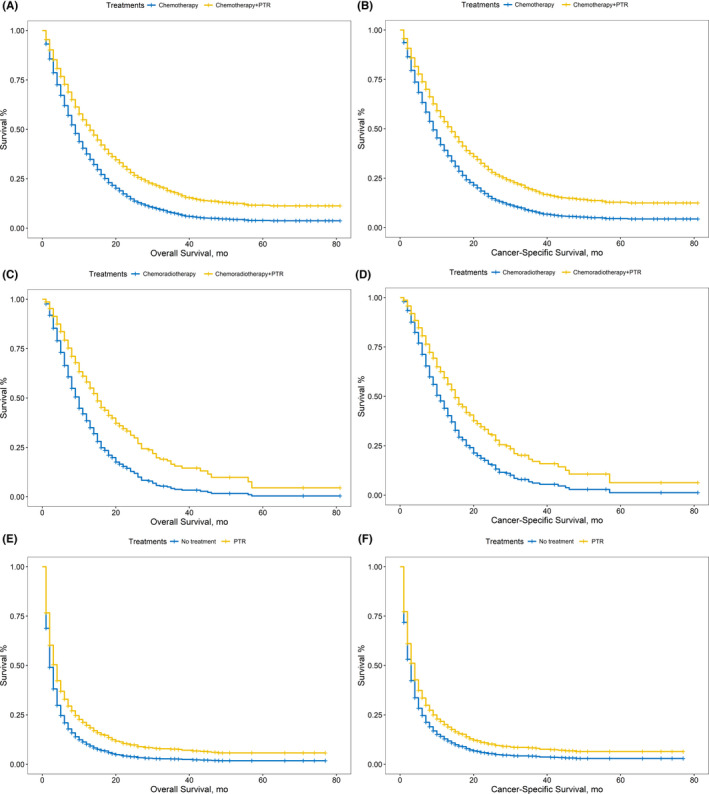
(A) Comparison of OS between patients receiving chemotherapy and chemotherapy plus PTR with covariates adjusted. (B) Comparison of CSS between patients receiving chemotherapy and chemotherapy plus PTR with covariates adjusted. (C) Comparison of OS between patients receiving chemoradiotherapy and chemoradiotherapy plus PTR with covariates adjusted. (D) Comparison of CSS between patients receiving chemoradiotherapy and chemoradiotherapy plus PTR with covariates adjusted. (E) Comparison of OS between patients receiving with covariates adjusted. (A) Comparison of CSS between patients receiving no treatments and PTR only with covariates adjusted