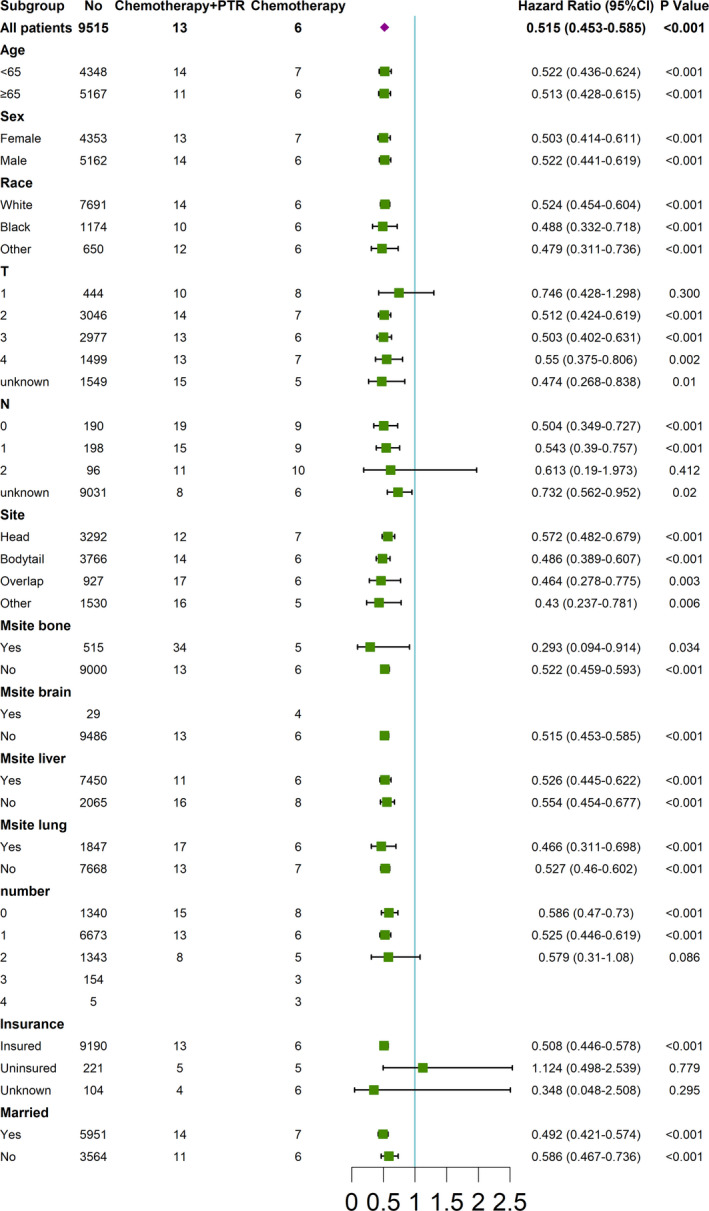
FIGURE 6.

Subgroup analysis of the association between PTR and OS using forest plot (chemotherapy plus PTR vs. chemotherapy). CI, confidence interval; T, tumor stage; N, nodal stage; Msite, metastatic site, including brain, liver, bone and lung; number, metastatic organ summation
