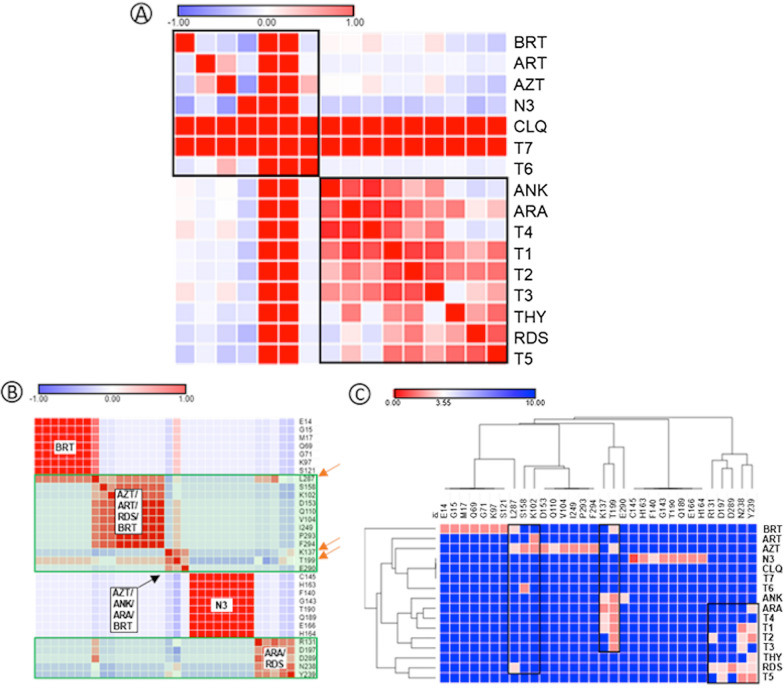
Fig. 4.
Heatmap representation of binding between Mpro and ligands. A Pearson’s similarity test for ligands analyzed on this study; B Pearson’s similarity test between Mpro amino acid residues; C interactions between ligands and Mpro residues. AZT (azithromycin); BRT (baricitinib); RDS (remdesivir); ANK (anakinra); CLQ (chloroquine); ART (artemisin); ARA (artemisin acid); THY (thymoquinone). For interpretation, the range varies from − 1 (blue) to + 1 (red), where red indicates stronger and closer interactions, while blue indicates weak and distant interactions

