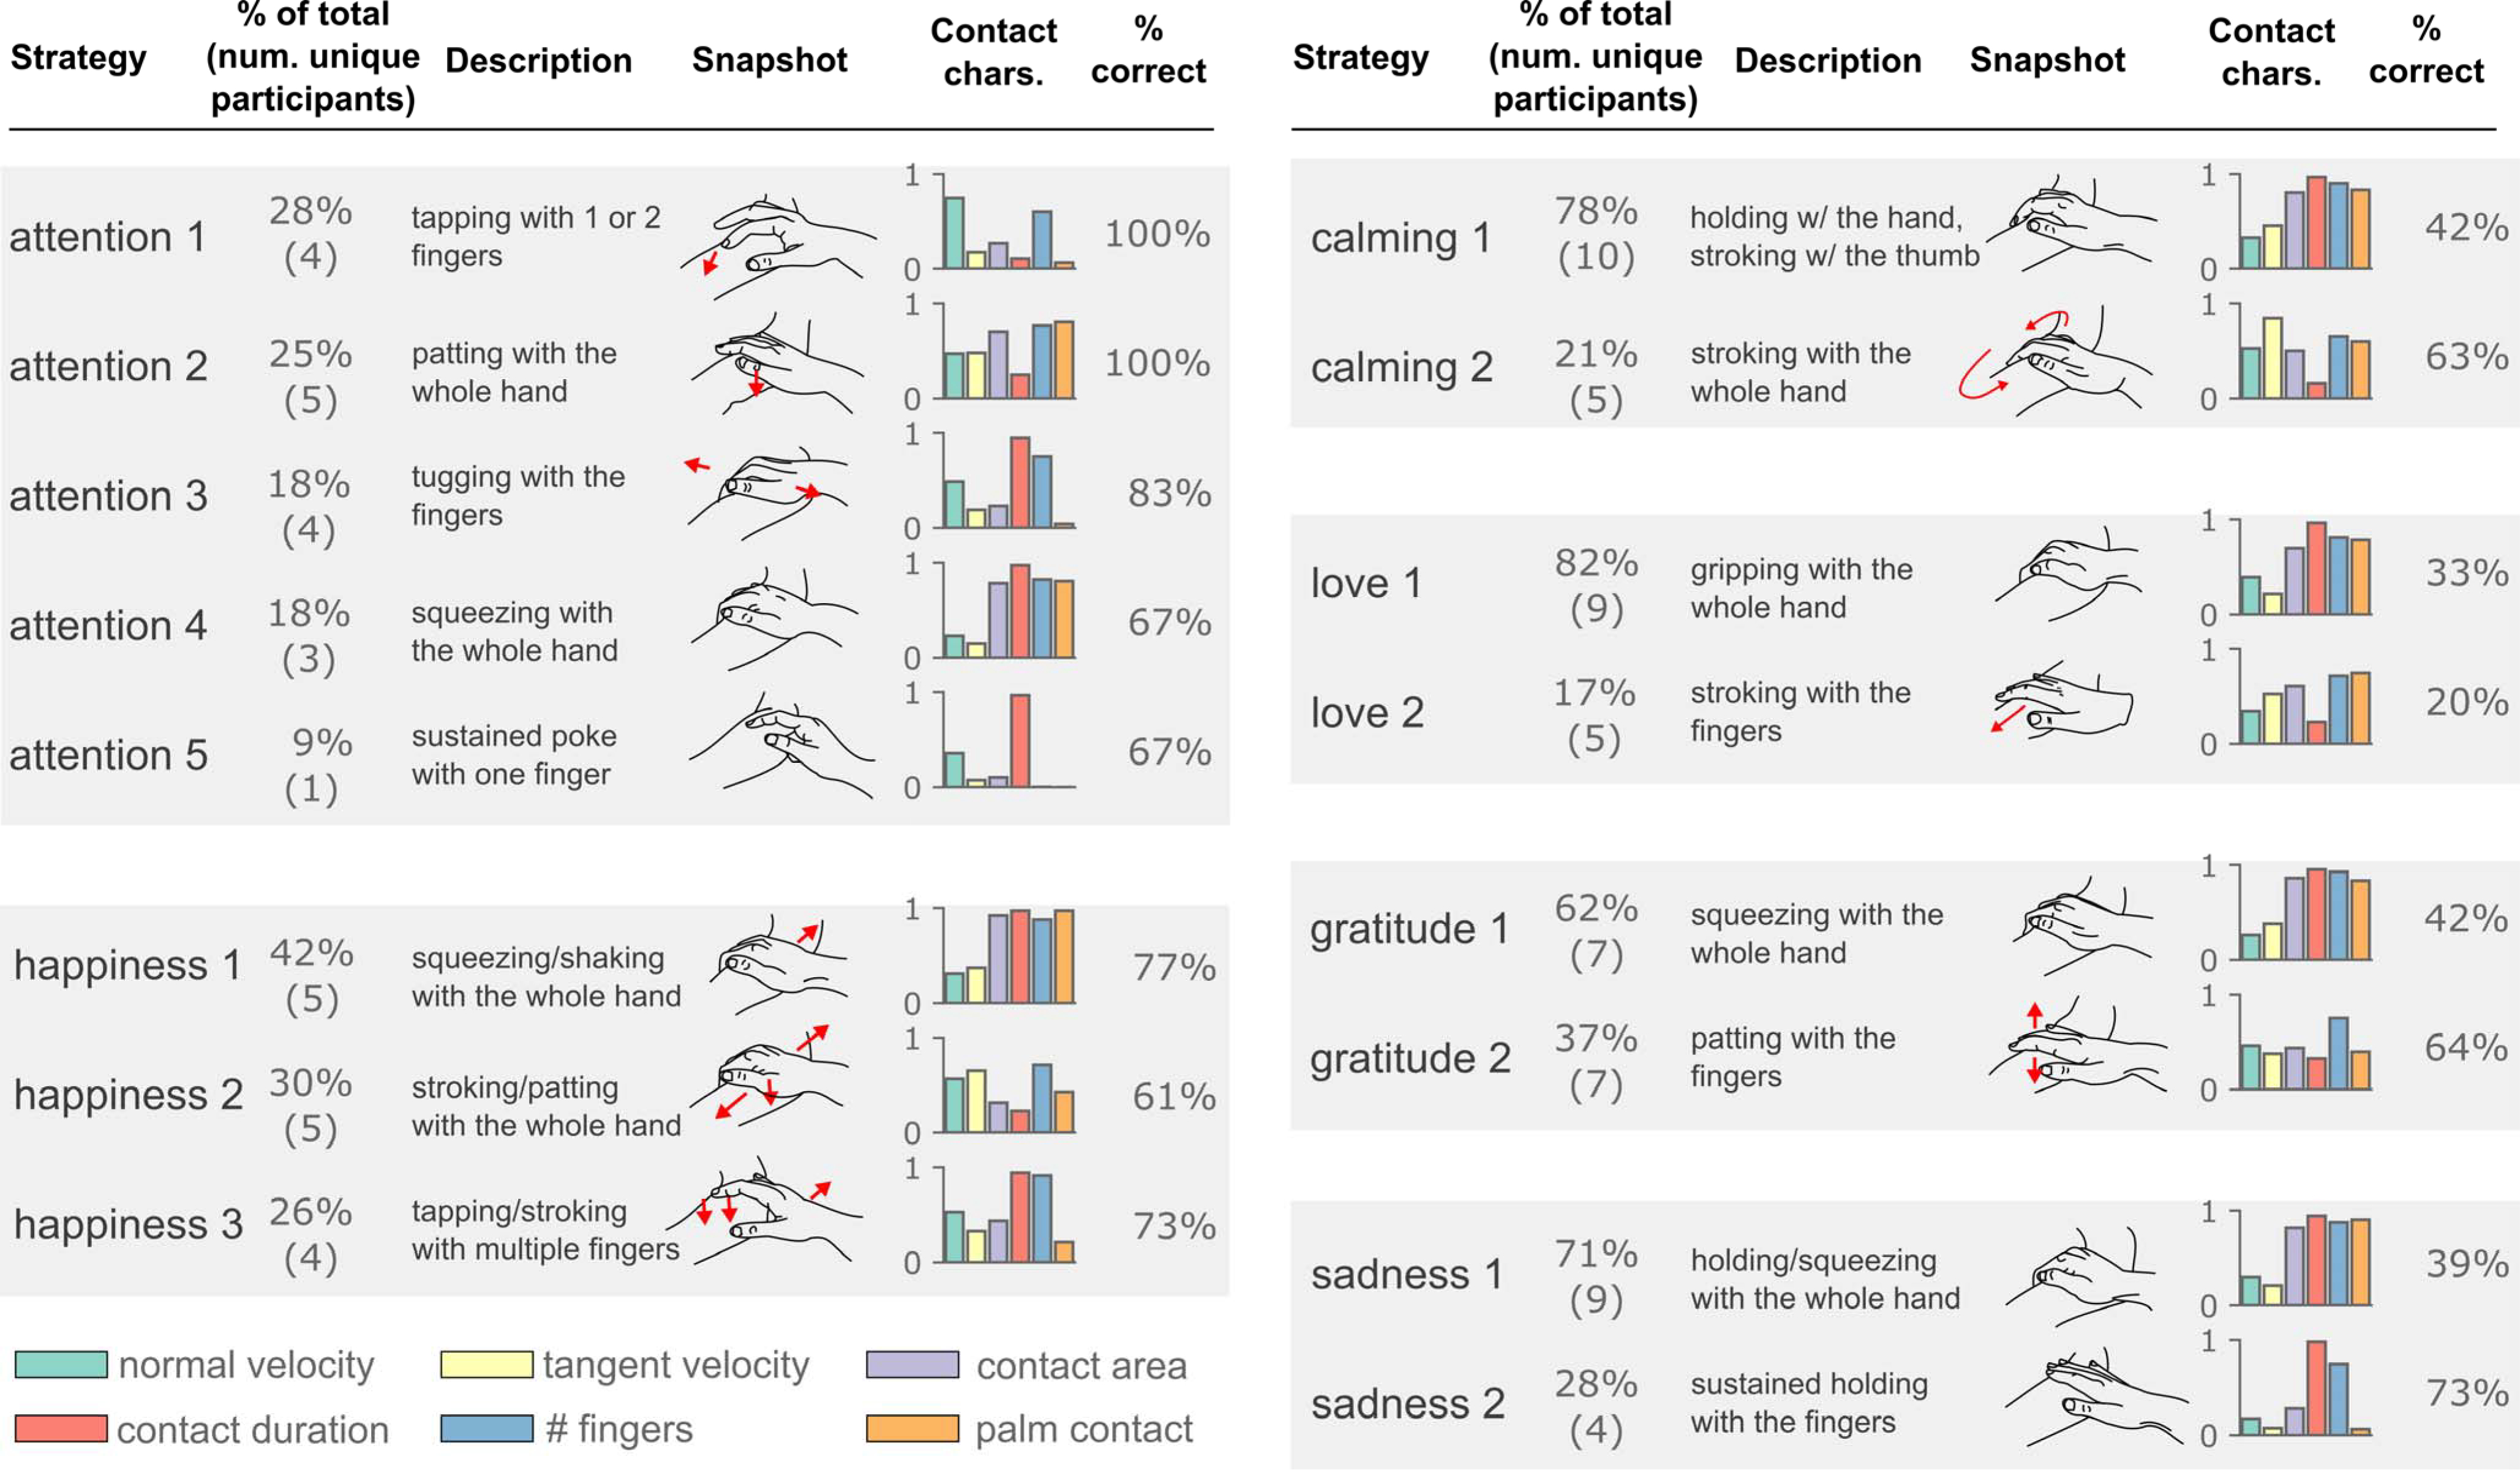
Fig 6. Common expression strategies for each gesture.

Via k-means clustering analysis, multiple “expression strategies” were determined. For each gesture, the strategies are listed, along with 1) the percent of the gestures that were clustered into each strategy, 2) the number of unique participants which used each gesture (out of 10), 3) a description along with a representative “snapshot” of each gesture, 4) the relative quantities of our six contact characteristics, and 5) the percent of the time that the receiver correctly identified the strategy. % total values are floored to the nearest whole percent.
