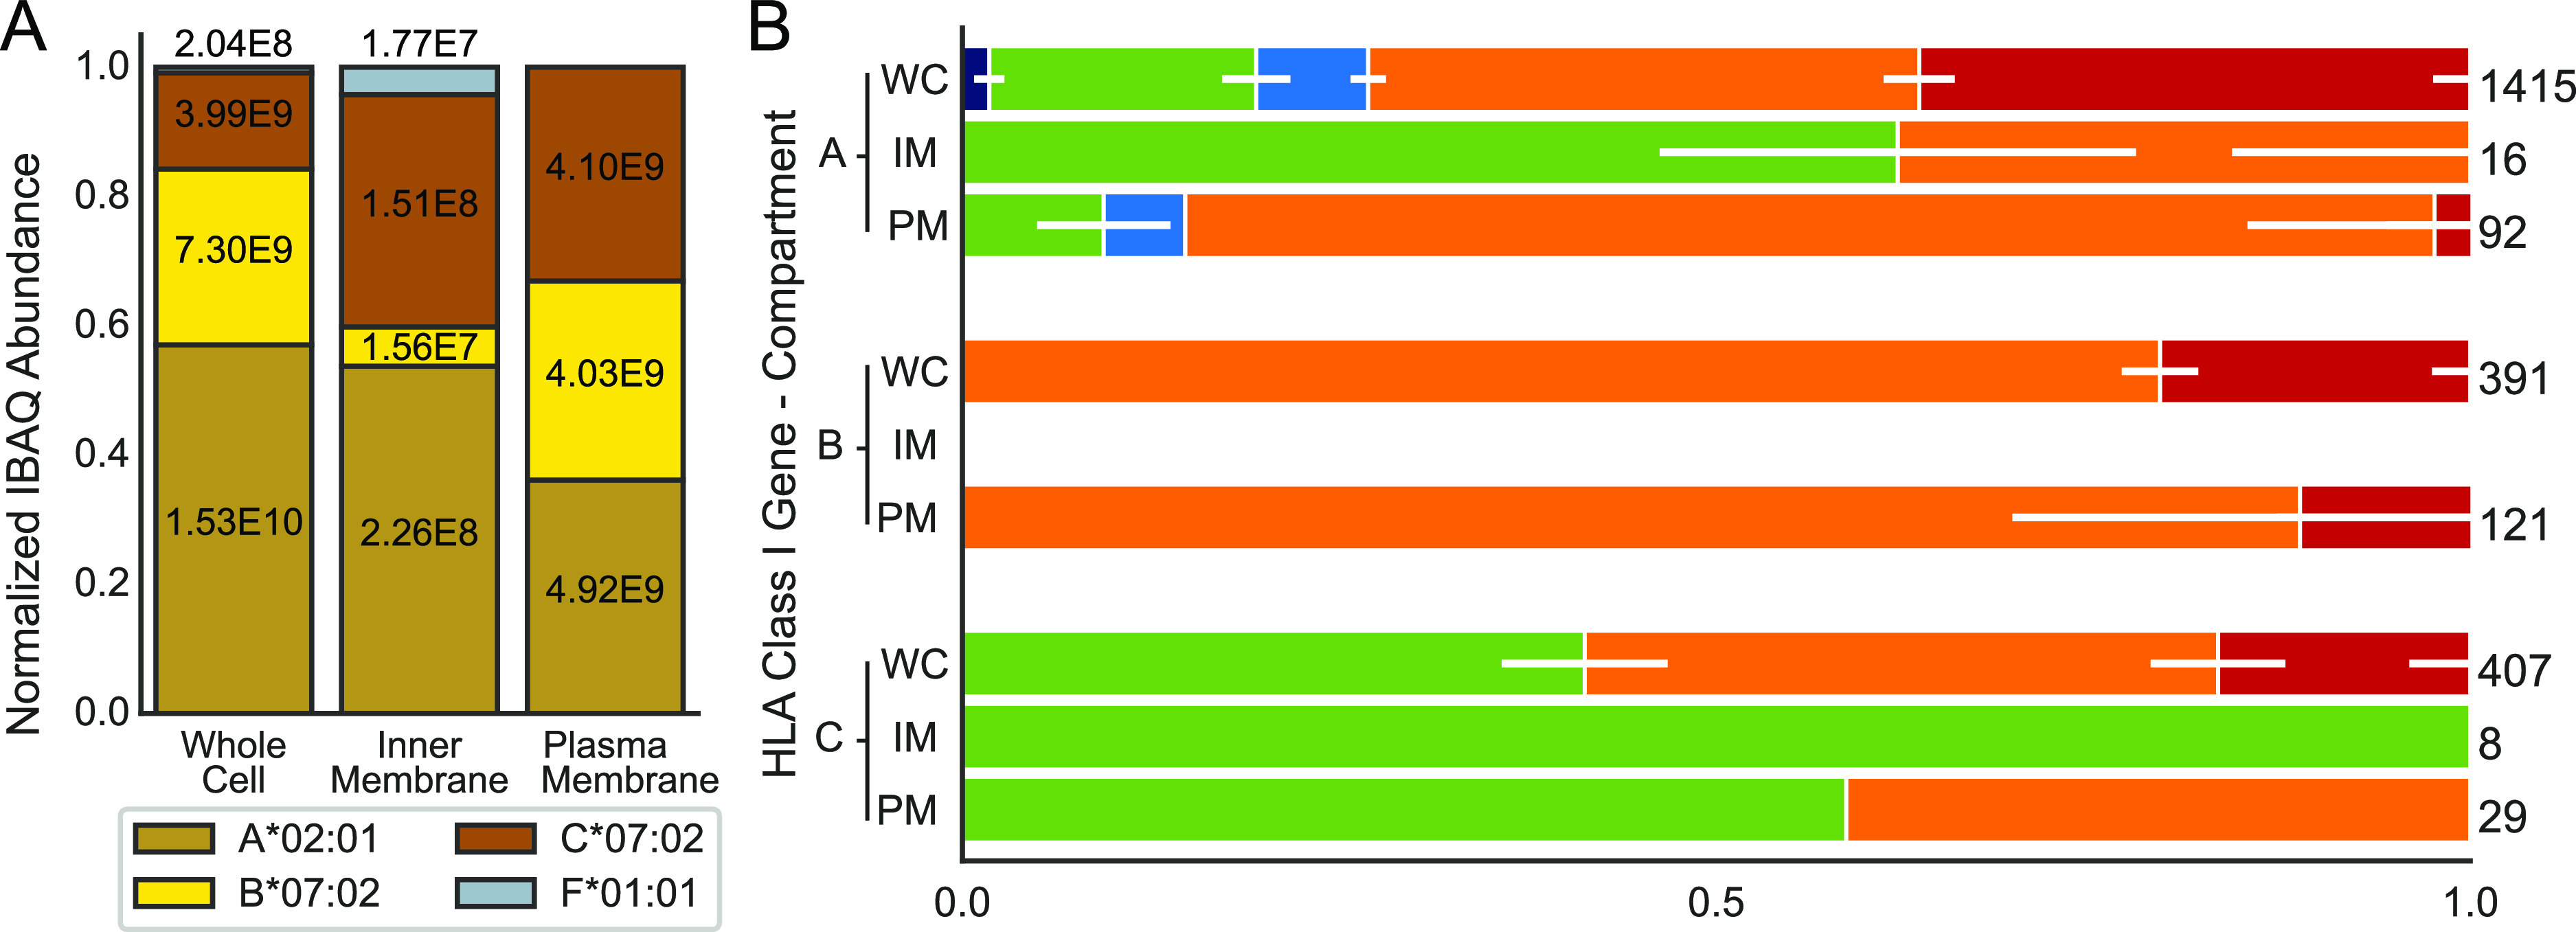
Figure 4.

HLA abundances and glycosylation in different compartments of the JY cells. (A) Normalized protein abundances of different HLA class I genes in WC lysates, and the IM (ER and Golgi) and PM fractions determined by proteomics, using solely unique non-glycopeptides for quantification. Within the bars, the non-normalized values are depicted. (B) Stacked bar plots depicting the distribution of glycans for each HLA class I gene in each of the three analyzed fractions. Abbreviations WC, IM, and PM are used to specify the compartments. Within the bars, the horizontal white lines depict the standard deviation averaged over nine injection replicates for the WC and three injection replicates for IM and PM preparations. On the right of each bar, values indicate the cumulative number of glycopeptides detected across all injection replicates. Due to the low abundance of HLA-B in the IM fraction, and for HLA-F, no glycopeptides could be detected following the cellular fractionation. The WC data presented in this figure are identical to the JY cell data presented in Figure 2.
