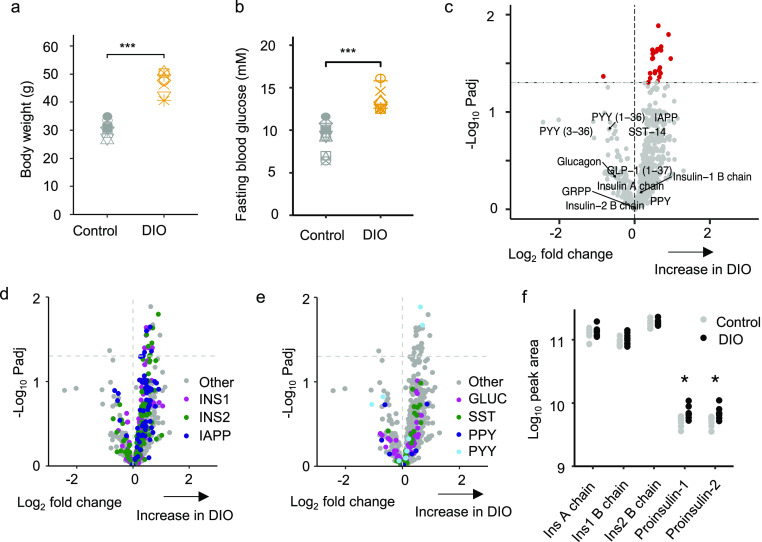
Figure 4.
Peptidomic comparison of islets from DIO mice and to lean controls. Body weights (a) and fasting blood glucose levels (b) of DIO mice vs lean controls. (c–e) Volcano plots displaying log2 fold change vs −log10 of the adjusted p value for each peptide. Horizontal dotted line indicates significance threshold of p = 0.05. A positive log2 fold change indicates an increase in DIO mice. 718 t tests were performed to analyze for significant differences in peptides matched between the groups with a permeation-based method used to adjust for multiple comparisons. In (d,e), peptides from different prohormones are colored in each plot: IAPP and INS derived peptides in (d). GLUC, SMS, PPY, and PYY derived peptides in (e). (f) Peak area of processed insulin-1 and -2 chains in addition to proinsulin-1 and -2. Statistical comparison made using unpaired t test without adjustments for multiple comparisons. *p < 0.05. n = 7 for control group and n = 8 for DIO group.

