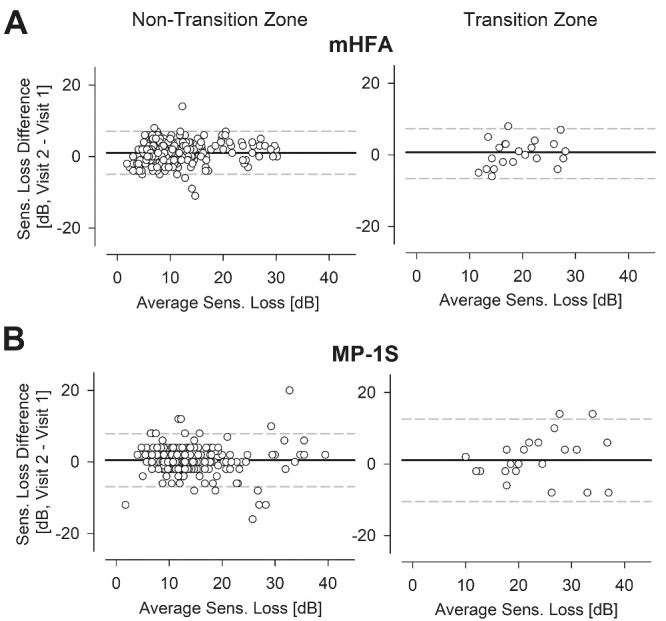
Figure 4.

Test–retest variability of the SL estimated from the two perimeters with blue stimuli in the non–transition-zone and transition-zone loci in subjects with RP. Bland–Altman plots revealed some variability across two consecutive tests 6 months apart for the mHFA (A) and the MP-1S (B), with higher variability for loci in the transition zone (right) as opposed to the loci in the non-transition zones (left).
