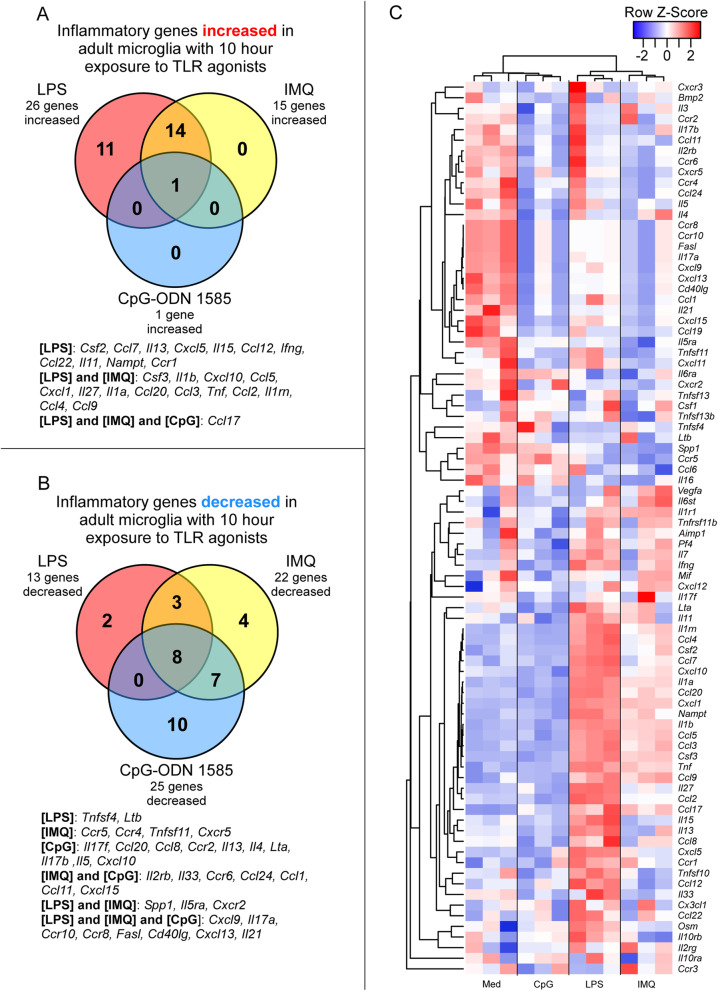
Fig. 3.
Alterations in expression of 84 inflammation-associated genes in adult microglia after 10 h of exposure to TLR agonists ex vivo. RNA from cultured microglia isolated from 3 adult mice and exposed to LPS, IMQ, CpG-ODN 1585 (CpG), or medium alone (Med) was assayed by qRT-PCR using the mouse inflammatory cytokine and receptor array by QIAGEN. Panel A shows a Venn diagram of inflammatory genes increased in adult microglia after TLR agonists exposure relative to adult microglia in medium alone. Panel B shows a Venn diagram of inflammatory genes decreased in adult microglia in response to TLR agonists relative to adult microglia in medium alone. Panel C is a Pearson correlation heatmap and average linkage hierarchical cluster analysis of the row Z-scores of the Delta CT from the array of 84 inflammatory cytokine and receptor genes obtained from the analysis of RNA from adult microglia exposed to TLR agonists and medium alone. Each group consisted of an n = 3. Refer to Additional File 1 for the complete dataset

