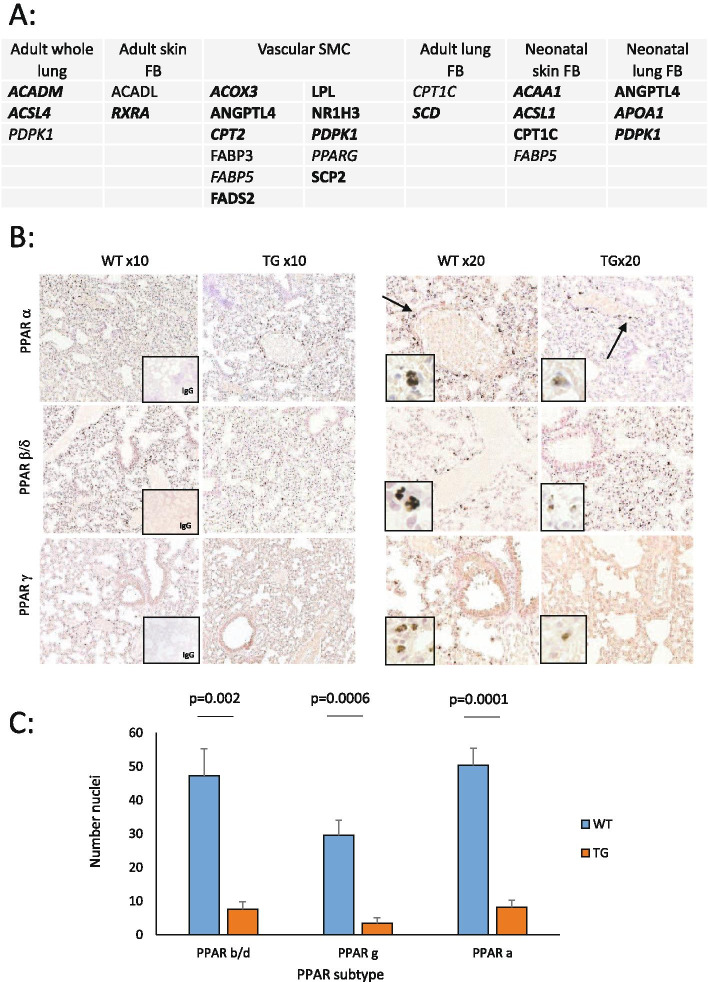
Fig. 1.
Dysregulated PPAR-associated gene and protein expression in TβRII∆k-fib mouse (TG) skin, lung, explanted fibroblasts and aortic smooth muscle cells. A Illumina gene array expression across tissues and explanted cells from TG compared to wildtype (WT) littermates. Bold- downregulated in TG; not bold- upregulated in TG; normal font- significant, P < 0.05; italicised font- trend only, P < 0.10; FB = fibroblast explant culture; aSMC = aortic smooth muscle cell explant culture, n = 3 all groups. B Representative immunohistochemical stains for PPAR subtypes in WT and TG, low power (× 10) and high power (× 20) including IgG control (n ≥ 3 each group). C Number of positive nuclei per high power field (HPF) in TG and WT immunohistochemical stains for each PPAR subtype

