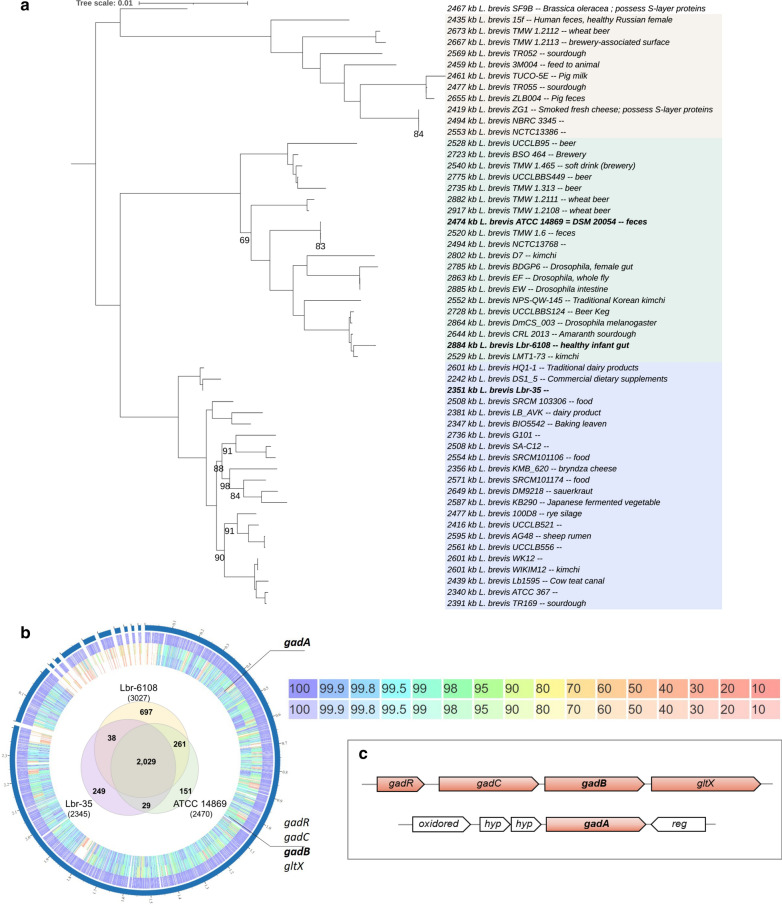
Fig. 1.
Genomic comparison of the GAD operon in Levilactobacillus brevis strains. A Phylogenetic tree of the L. brevis species based on 500 core proteins using RAxML in the Phylogenetic Tree Building Service of the PATRIC database [32]. Support values were generated using 100 rounds of the ‘Rapid’ bootstrapping option of RAxML; only bootstrap values lower than 100 are shown. Tree scale is given in amino acid substitutions per site. Genome sizes are shown to the left of each leaf. The three different clades are shaded different colors. B The circular genome map compares overall protein homology across the genome, with rings from the inside out representing ATCC 14869, Lbr-35, and Lbr-6108. The Venn diagram shows number of shared genes. The heat map shows percent protein sequence identity of the bidirectional best hit (top) and unidirection-al best hit (bottom). C An overview of the genes for glutamate metabolism in L. brevis, including the canonical GAD operon and the separate gadA

