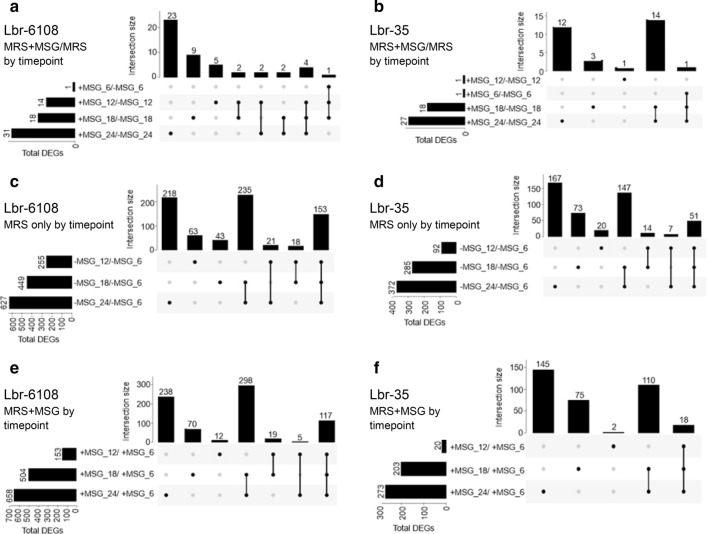
Fig. 3.
Upset diagram to show significantly differentially expressed genes in Levilactobacillus brevis Lbr-6108 and Lbr-35 throughout the experiments. Individual lines are denoted by having MRS only (−MSG) or MRS + MSG (+ MSG) followed by the timepoint number. The top graphs compare the number of significantly expressed genes at the same timepoints but with different media (MRS and MRS + MSG) for (A) Lbr-6108 and (B) Lbr-35. The middle graphs compare the T6 (pre-log phase) to T12 (mid-log), T18 (pre-stationary) and T24 (stationary) in only MRS for (C) Lbr-6108 and (D) Lbr-35. The bottom graph compares the T6 (pre-log phase) to T12 (mid-log), T18 (pre-stationary) and T24 (stationary) in MRS + MSG for (E) Lbr-6108 and (F) Lbr-35

