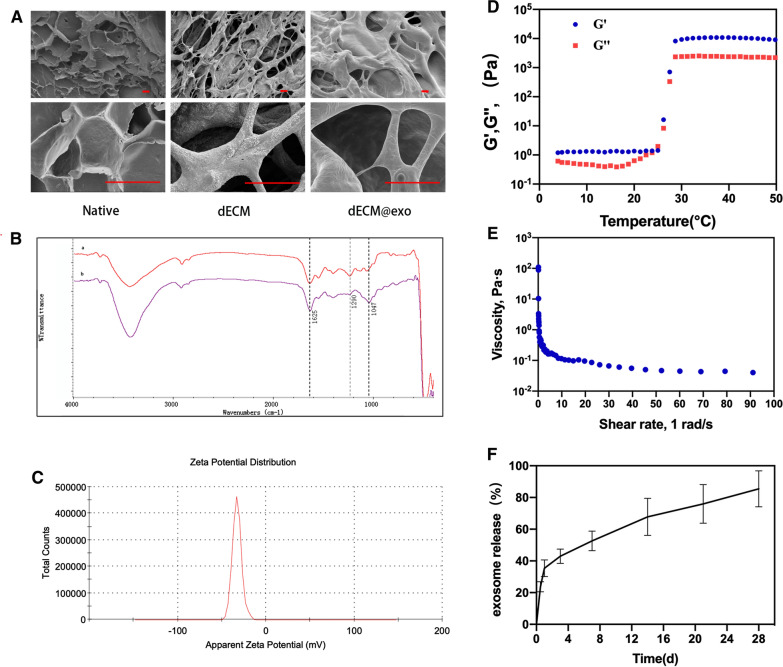
Fig. 2.
Synthesis and characterization of dECM @ exo. A SEM analysis of NP, dECM and dECM@exo. Scale bar = 20 μm. B The FTIR of spectra of NP (a) and dECM (b). The absorption band at 1047 cm−1 corresponds to the stretching mode of the C–N bond. The peak at 1290 cm−1 corresponds to the NH2 groups. The C=O stretching was detected at the wave-length of 1625 cm−1. The peak at 1290 cm−1 corresponds to the NH2 groups. C Zeta potential of exosomes. D The G′ and G′′ changes of the dECM@exo hydrogel at 4–50 °C. E The viscosity changes of the dECM@exo hydrogel at shear rates of 1 1/s to 100 1/s. F Control-release curve of dECM@exo

