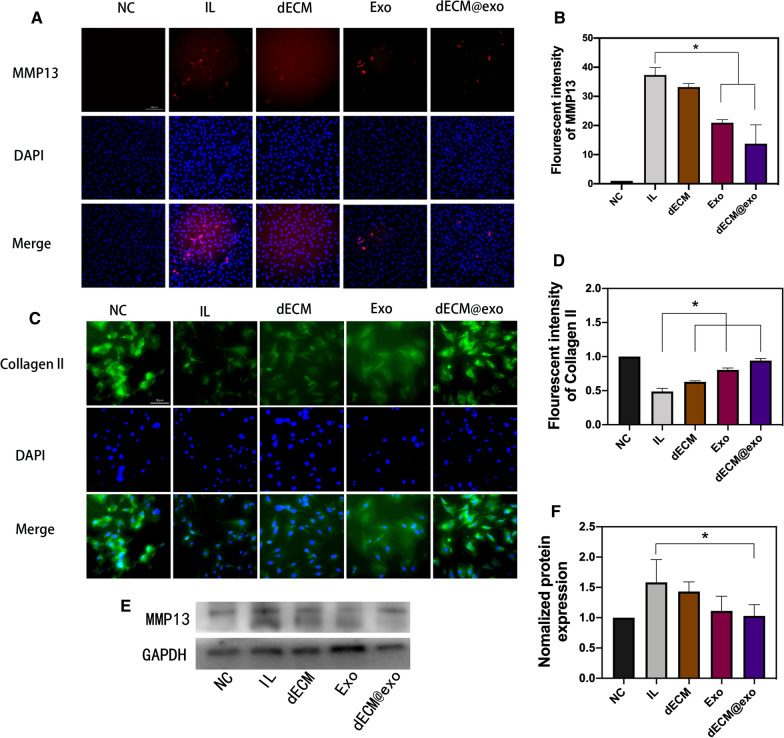
Fig. 4.
dECM@exo regulates the matrix metabolism of NPCs. A Fluorescence images of MMP13 after IL-1β + TNF-α stimulation in the NC, IL, dECM, Exo and dECM@exo groups. Scale bar = 100 μm. B Quantitative analysis of the fluorescence intensity of MMP13. Data are the mean ± SD (n = 4). *P < 0.05. C Fluorescence images of collagen ll after IL-1β + TNF-α stimulation in each group. Scale bar = 50 μm. D Quantitative analysis of the fluorescence intensity of collagen ll in each group. E, F Western blot of MMP13 in each group. Data are presented as the mean ± SD (n = 3). *P < 0.05

