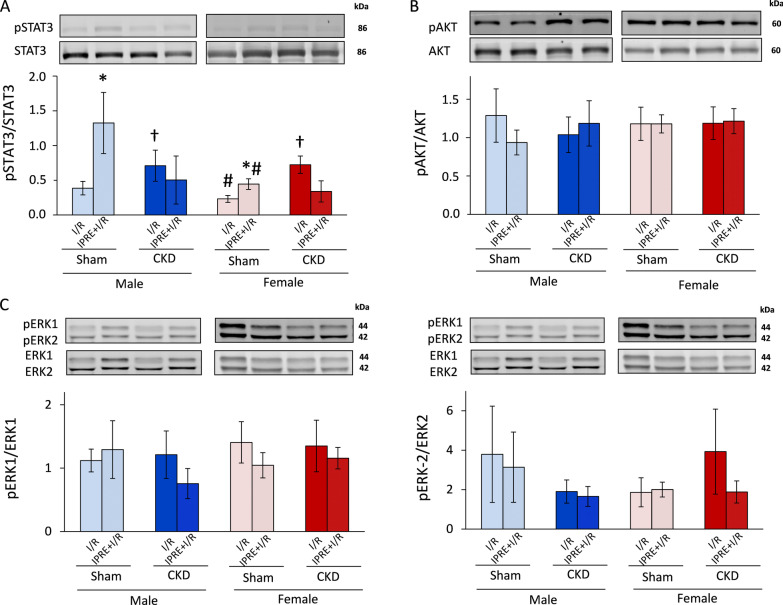
Fig. 6.
The effects of sex and CKD on the activation by phosphorylation of STAT3, AKT, and ERK1/2. A Phospho-STAT3/STAT3 ratios; B phospho-AKT/AKT ratios; C phospho-ERK1/ERK1 ratios; D phospho-ERK2/ERK2 ratios. Values are means ± SEM, n = 5–7 (male sham I/R: n = 5, male sham IPRE + I/R: n = 6, male CKD I/R: n = 6, male CKD IPRE + I/R: n = 5, female sham I/R: n = 6, female sham IPRE + I/R: n = 7, female CKD I/R: n = 7, and female CKD IPRE + I/R: n = 5), *p < 0.05, IPRE + I/R vs. I/R subgroups, #p < 0.05, females vs. males, †p < 0.05, CKD vs. sham-operated groups, p-values refer to three-way ANOVA (Holm–Sidak post hoc test). CKD chronic kidney disease, IPRE ischemic preconditioning, I/R ischemia/reperfusion. Bands on the representative Western blot images correspond to the groups represented by bar graphs: 1. male sham I/R, 2. male sham IPRE + I/R, 3. male CKD I/R, 4. male CKD IPRE + I/R, 5. female sham I/R, 6. female sham IPRE + I/R, 7. female CKD I/R, 8. female CKD IPRE + I/R. Representative bands are framed on the original and uncropped images in Additional file 2: Fig. S2, Additional file 3: Fig. S3, Additional file 4: Fig. S4

