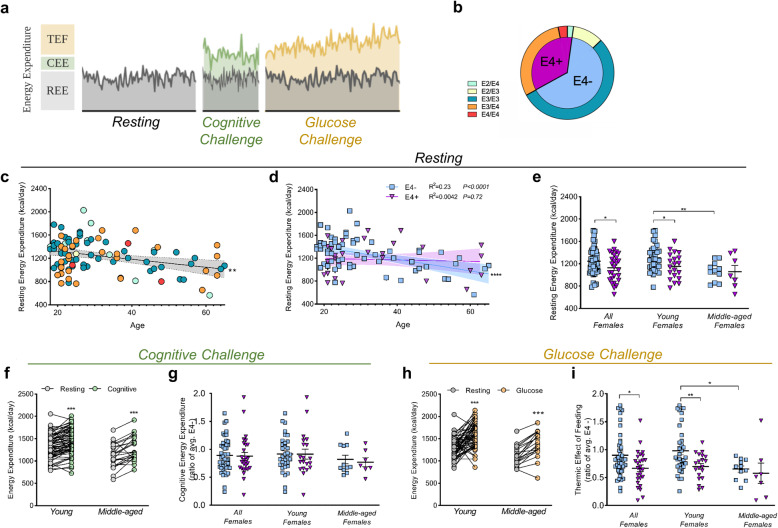
Fig. 4.
Female Ε4 carriers show lower resting energy expenditure and lower thermic effect of feeding after a glucose challenge. a Experimental design of study. Individual components of energy expenditure (EE) were assessed in three distinct periods. Resting energy expenditure (REE) was assessed during the resting period. Cognitive energy expenditure (CEE) was assessed during the cognitive challenge and defined as difference in the area under the curve (AUC) of EE during the cognitive challenge and the AUC of EE from the resting period. Thermic effect of feeding (TEF) was assessed during the glucose challenge and calculated as the difference in AUC of EE during the glucose challenge and AUC of REE. b APOE genotypes of subjects represented in the study (E4- n = 61, E4+ n = 33; E2/E4 n = 2, E2/E3 n = 10, E3/E3 n = 51, E3/E4 n = 28, E4/E4 n = 3). c Correlation of average REE with participant age (Pearson correlation R2 = 0.11, **P < 0.01, n = 94). d Correlation of average REE and participant age separated by Ε4 carriers (purple) and non-carriers (blue) (Ε4- R2 = 0.233, ****P < 0.0001; Ε4+ R2 = 0.0042, P = 0.719, E4- n = 61 and E4+ n = 33). Shaded areas refer to 95% confidence intervals. e Average REE for all, young, and middle-age E4- (n = 44, 33, and 11 respectively) and E4+ females (n = 27, 20, and 7 respectively) (*P < 0.05, **P < 0.01, unpaired t-test, two-tailed). f Average EE between resting and cognitive test periods in young (n = 71) and middle-aged (n = 23) participants. (***P < 0.001, paired t-test, two-tailed). g CEE for all female participants and for the two age cohorts. h Average EE between resting and glucose challenge periods in young and middle-aged participants (***P < 0.001, paired t-test, two-tailed). i TEF for all females and for the two age cohorts, further separated by Ε4 carriers and non-carriers. (*P < 0.05, unpaired t-test, two-tailed)

