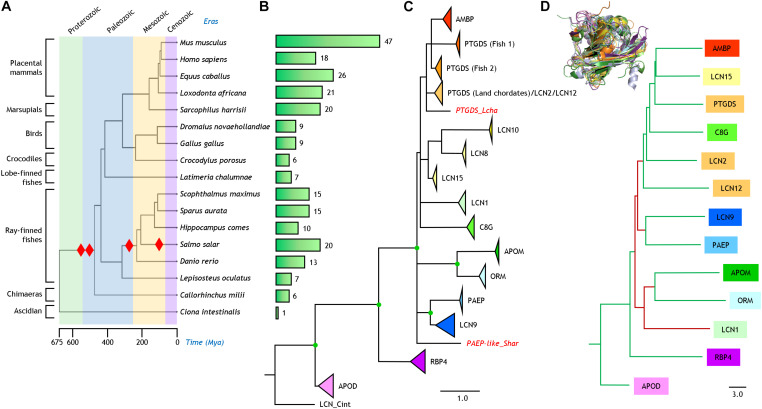
FIGURE 1.
Phylogenetic relationships of Lipocalins. (A) Phylogeny and evolution timescale of the organisms selected for our analysis. Red diamonds indicate whole genome duplications. (B) Bars depicting the number of bona fide Lipocalins found in each organism. (C) Phylogenetic tree of 250 Lipocalin protein sequences reconstructed from a structure-based multiple sequence alignment and a ML method. The tree was rooted with a tunicate Lipocalin (LCN_Cint) considered as outgroup. Unsupported nodes (bootstrap <65%) are excluded and branches joined as a polytomy. Lipocalin monophyletic clades (bootstrap >85%) are shown collapsed and color-coded. Scale branch length represents number of amino acid substitutions per site. Individual Lipocalins with unsupported groupings are shown in red and italics. Green dots point to full bootstrap support. (D) Dendrogram depicting the relationships of thirteen human Lipocalins structurally aligned (3D superimposition shown as an inset). Scale branch length represents distances obtained from the DALI similarity matrix. Branches in green and maroon point to relationships concordant or discordant, respectively, with the protein sequence-based phylogeny in (C).

