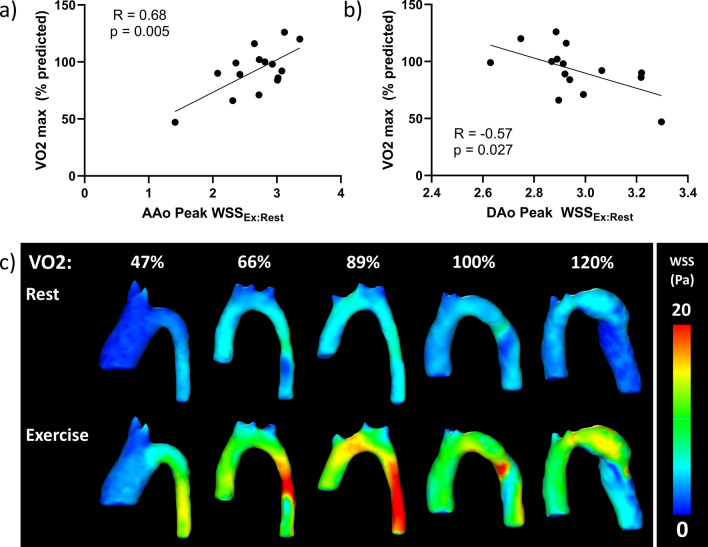
Fig. 3.
The relationship of the ratio of peak WSS in exercise to rest (WSSEx:Rest) in the ascending aorta (AAo) and descending aorta (DAo) with exercise capacity (VO2 max). a AAo Peak WSSEx:Rest correlated positively with VO2 max. b DAo Peak WSSEx:Rest correlated negatively with VO2 max. c Representative peak WSS patterns in aortas of patients in order of VO2 max during simulated rest and exercise. With worse VO2 max, there is a lower change of peak WSS seen in the moderately dilated AAo while there is a larger change in WSS in the relatively small DAo. With better VO2 max, there is a higher change of WSS from rest to exercise in the normal size AAo while lower change in peak WSS is seen in the mildly dilated DAo

