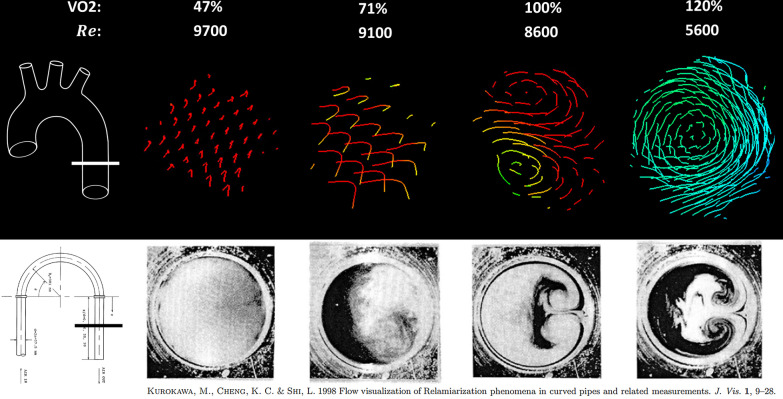
Fig. 7.
Visualization of flow by 4D flow CMR compared to smoke injection in a curved pipe. Top) Streamline flow by 4D flow CMR in a cross section of the distal descending aorta (DAo) as shown in the schematic on the left in four example patients of varying exercise capacity (VO2 max) from poor to excellent (left to right). Increasing secondary flow formation is seen as Reynolds number (Re) decreases and VO2 increases. Bottom) Reproduced and adapted from Kurokawa et al (CC BY license 4.0): cross-sections of pipe after a 180 degree bend (location shown at left) with decreasing Re from left to right. High Re leads to completely turbulent flow with no secondary flow visualization (left). With decreasing Re, secondary flow formation strengthens creating fully developed Dean vortices at low Re (right)

