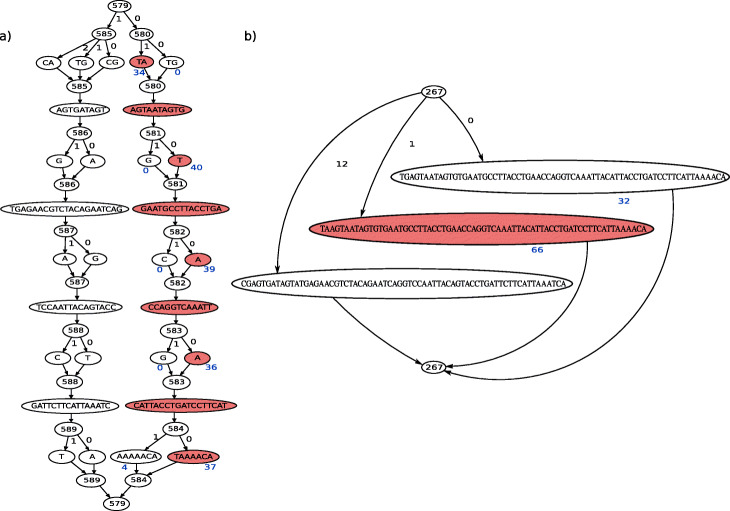
Fig. 4.
Nested graphs improve site resolution and coverage differences. A call for part of DBLMSP2 is shown (P. falciparum reference genome Pf3D7 chromosome 10 positions 1433921:1433987). Red nodes mark the called allele and spell the same sequence across nested (a) and non-nested (b) graphs. Numbered nodes mark variant sites and edges are labelled by haplogroup. Blue text under the nodes gives read coverage for the called and next best allele. In the non-nested graph, the next best allele is long and only one SNP away from the best allele so that reads mapping to common sequence add coverage to both. This reduces coverage differences compared to the nested graph. For clarity, only 3 of the 13 alleles that exist in the non-nested graph are shown in b

