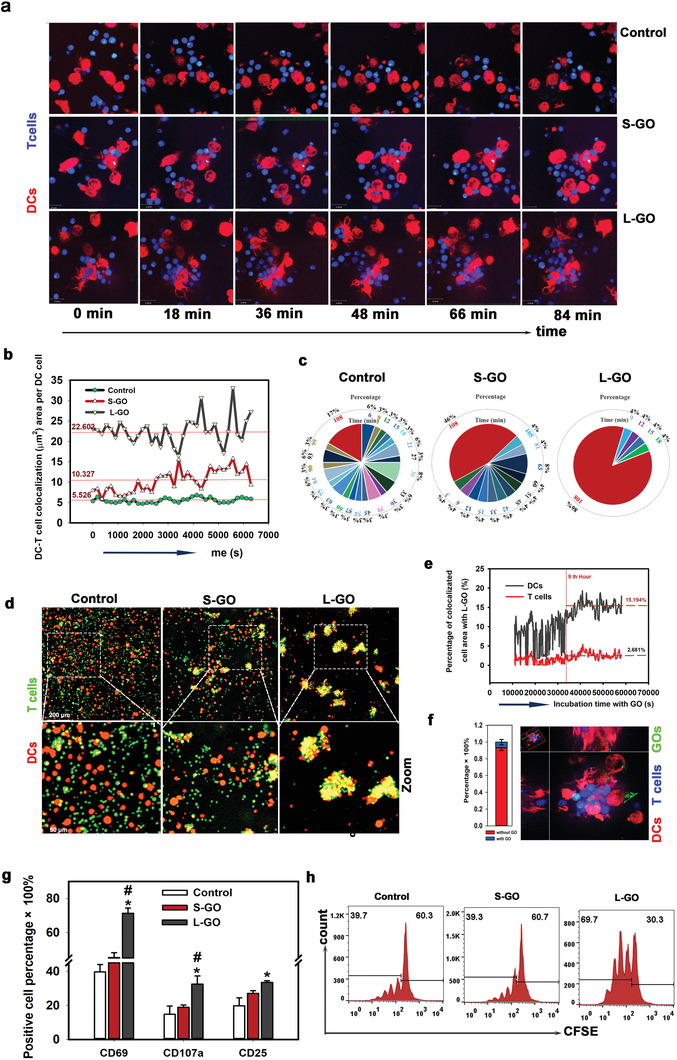
Figure 2.

L‐GOs enhanced DC–T‐cell synaptic contact and T cell priming. a) Dynamic interaction between DCs and T cells by confocal imaging over 100 min. Red: DCs from tdTomato transgenic mice; Blue: CD8+ T cells from OT‐I transgenic mice. b) The direct contact area of DC–T‐cells determined by calculating the co‐localized areas visualized using light channels 561 nm and 405 nm in dynamic microscopy images. c) Proportional distribution of the duration of DC–T‐cell adhesion. d) Images of DC–T‐cell clusters. Red: DCs; Green: T cells. e) L‐GO absorption on respective DCs and T cells determined by calculating the co‐localized areas visualized using light channel 488 nm (FITC‐labeled L‐GOs) with 561 nm (tdTomato + DCs) and 405 nm (CellTrack‐Blue‐labeled T cells). f) Proportion of L‐GO‐containing DC–T‐cell synapses. Left: statistical analysis; right: representative image of co‐localization of L‐GOs, DCs, and T cells. g) DCs induced T cell activation, as indicated by FACS analyses of CD69, CD107a, and CD25. T cells were gated by antibody of FITC‐anti‐CD8α+. Data are presented as means ± s.d; n = 3–5; The Shapiro–Wilk test was used to evaluate normality and the Holm–Sidak method was used for multiple comparisons. *p < 0.05 compared with the control group. #p < 0.05 compared with the S‐GO group. h) T cell proliferation by detecting CFSE dye dilution. Representative results from two or three replicates are shown.
