
Figure 5.
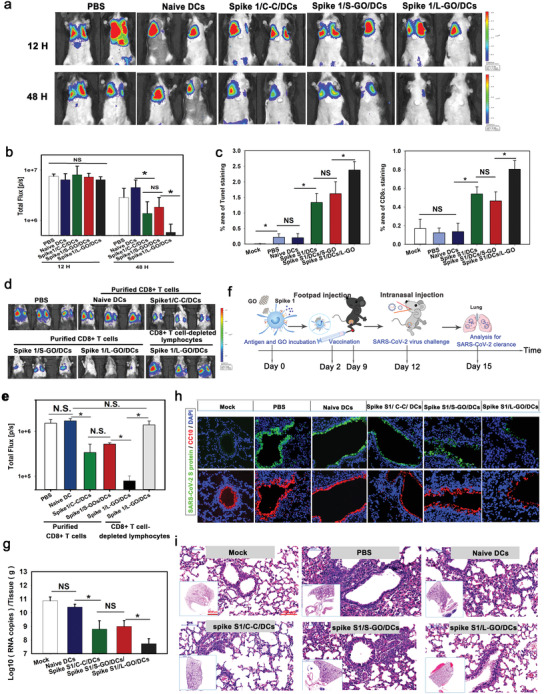
The priming of CTLs by DC vaccines against SARS‐CoV‐2. a) Bioluminescence imaging and b) statistical analysis of the clearance of spike 1 in the lungs. Data are presented as means ± s.d.; n = 5; the Holm–Sidak method was used for multiple comparisons; N.S.: not significant. c) Statistical data for TUNEL (Left panel) and CD8+ T cell staining of lung sections. Data are presented as means ± s.d.; n = 5; *p < 0.05 by the Holm–Sidak method; NS: not significant. d) Bioluminescence imaging of the clearance of spike 1 and e) a statistical analysis for adoptively transfused purified CD8+T cells isolated from spleens and PLNs of immunized mice. Data are presented as means ± s.d. n = 4; the Holm–Sidak method was used for multiple comparisons; *p < 0.05; NS: not significant. f) Schematic diagram of vaccination and viral challenge. g) Quantification of SARS‐CoV‐2 viral RNA in lungs of infected mice. Data are presented as means ± s.d.; n = 4–6; the Holm–Sidak method was used for multiple comparisons and t‐tests were used for pairwise comparisons; *p < 0.05; NS: not significant. h) Visualization of spike 1 and CC10 expression in lung sections. Green: SARS‐CoV‐2 Spike 1; red: CC10+ cub cell; blue: nuclei. i) Hematoxylin & eosin staining of lung sections. n = 4–6.