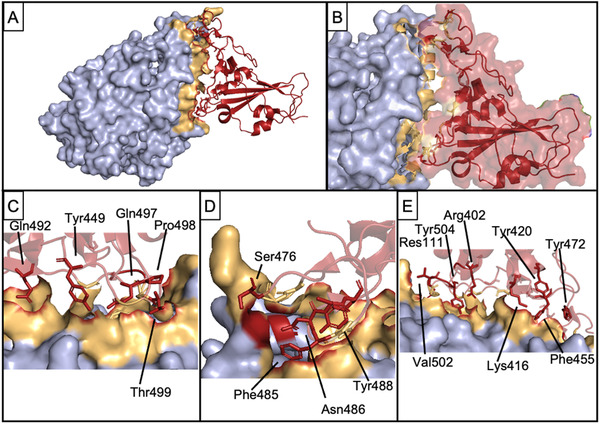
Figure 2.

Interaction of Spike RBD and ACE‐2. A) Bound complex between ACE‐2 (light blue) and Spike RBD (red). Tan shows PPI interface on ACE‐2. B) Close‐up view of the interaction interface. C–E) indicate and label crucial residues from Spike RBD which contribute to complex formation. PDB 7DMU.
