
Figure 3.
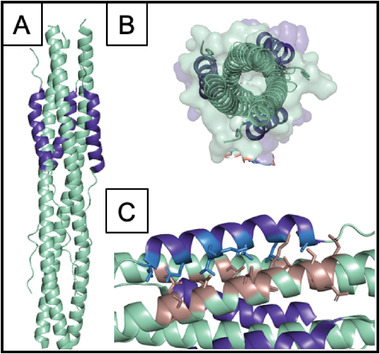
Structure of the HR1‐HR2 trimeric fusion core. A) Cartoon representation showing HR1 in cyan and HR2 in dark blue. B) Top‐down view. C) Key interacting residues between HR2 (side chains shown in light blue) and HR1 (side chains shown in tan). PDB 6LXT.