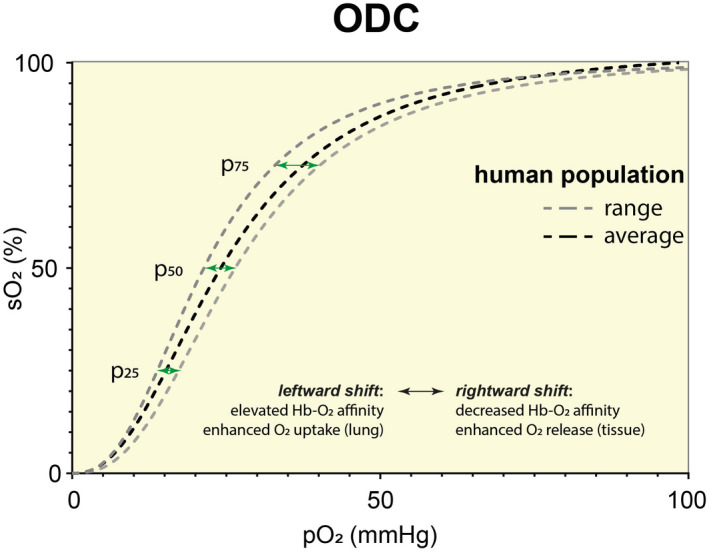
FIGURE 1.

Oxygen Dissociation Curve (ODC): Range in human population. Data were obtained from tonometric measurements of 60 young and healthy volunteers participating in an endurance exercise study as described in Balcerek et al. 11 The average ODC represents the mean of all 60 participants. To indicate the range in a human population, the ODCs of the participant with lowest and highest p50 values were chosen. The higher distance of pO2 at 75% O2 saturation (p75) compared to p50 and p25 (green arrows) indicate that the slope is steeper when ODC is shifting to the left
