Figure 1.

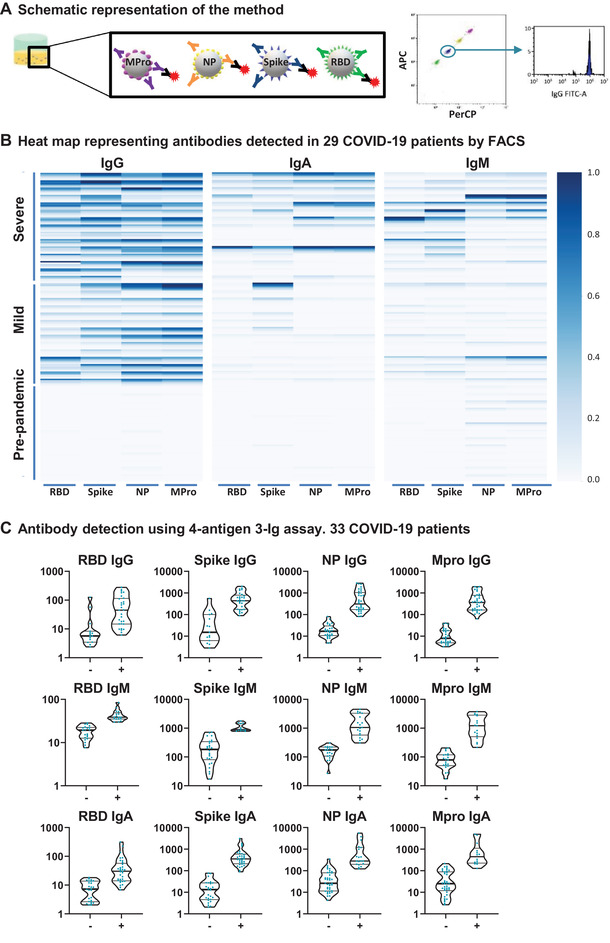
A multi‐antigen assay to detect SARS‐CoV‐2 specific antibodies. (A) Schematic representation of the method. Four different SARS‐CoV‐2 antigens (Mpro, NP, S, and RBD) were covalently coupled to magnetic beads with different fluorescence intensity in the APC and PerCP channels. Equal amounts of the different beads mixed in the same tube were incubated with plasma. SARS‐CoV‐2‐specific antibodies were visualized with fluorophore‐conjugated secondary antibodies followed by flow cytometry. (B) Heat map representing antibody titers from multi‐antigen COVID‐19 assays. Plasma from 15 healthy controls and 29 COVID‐19 patients were incubated with S‐, RBD‐, NP‐, and Mpro‐ coated beads. Specific IgG‐PE, IgA‐FITC+ IgM‐PE responses were analyzed by flow cytometry. The data are summarized in a heat map. Each column corresponds to one antigen while rows show four different plasma dilutions (1/100, 1/200, 1/600, 1/1800) for each individual. The intensity of the blue color depicts the amount of antibody. (C) Multi‐antigen assay for SARS‐CoV‐2 antibody detection in a single reaction. The assay was done, as in B, but only 1/100 dilution was tested and antibodies were developed with three combined anti‐human Ig antibodies (IgG‐FITC, IgM‐PE, and IgA‐PE‐Cyanine7). Statistic comparison was carried out using a Mann‐Whitney test.
