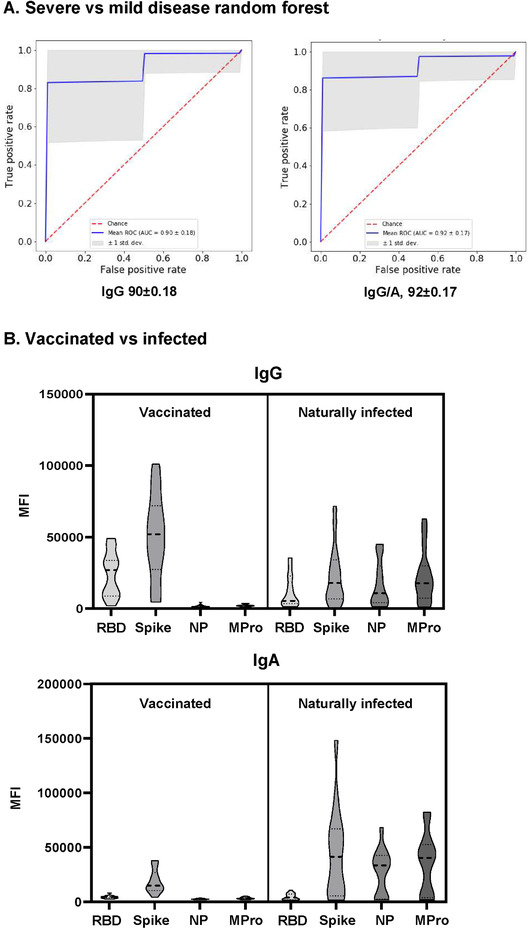
Figure 3.

(A) Algorithm for classification of COVID‐19 patient severity. A random forest was trained to discriminate between COVID‐19 patients with severe or mild disease, using either IgG data alone or including data from other isotypes, and then used to predict unseen patients. The mean ROC curve after 300 random repetitions is shown for each condition. (B) Comparison of vaccinated individuals and COVID‐19 convalescent patient antibody responses. Plasma IgG and IgA from 15 vaccinated donors (Pfizer/BioNTech), were compared to the antibodies produced by 15 naturally infected individuals.
