
FIGURE 1.
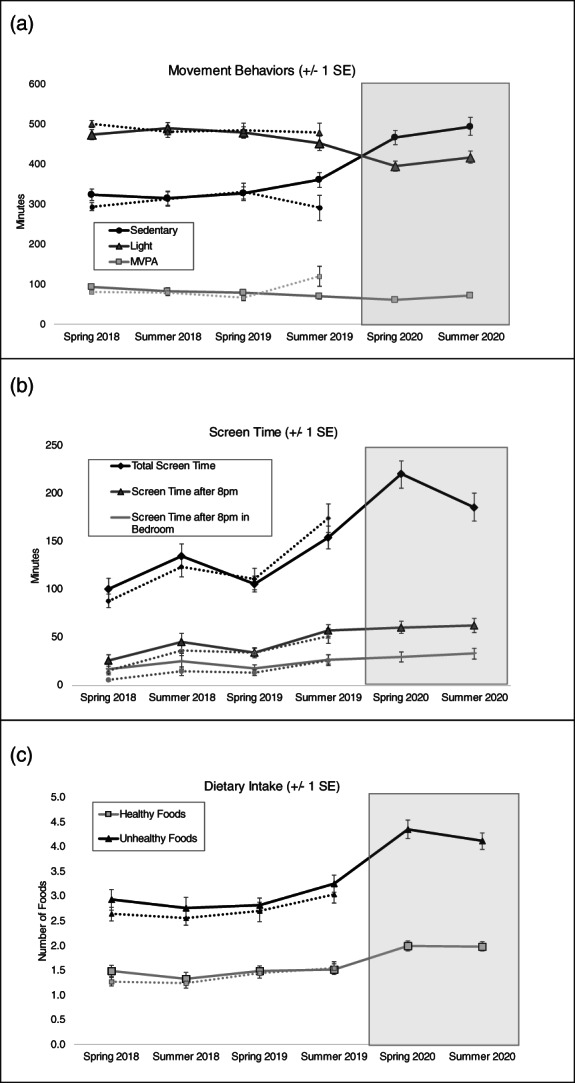
Mean estimates of (A) physical activity and sedentary behaviour, (B) screen time, and (C) dietary intake. Dotted lines indicate the trajectory for children who only provided data in 2018 and/or 2019. Solid lines indicate the trajectory for children who participated in the 2020 subsample. Raw means and standard deviations are presented in Table 3