FIGURE 3.

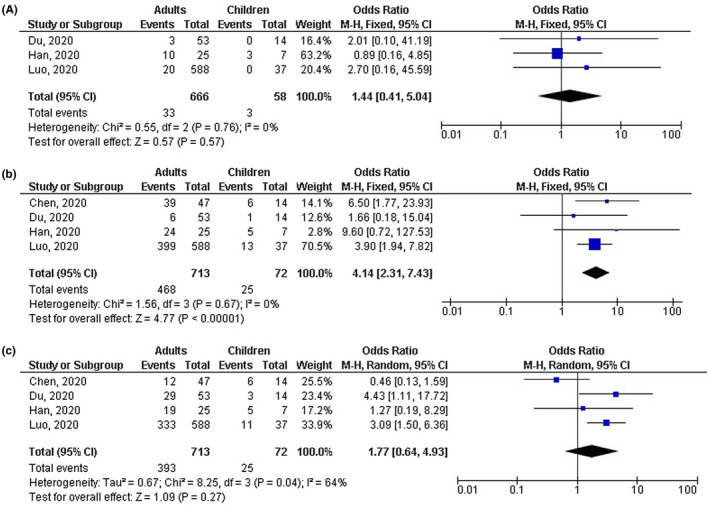
Forest plot of the effect of age on (A) number of cases with shortness of breath, (B) number of cases with fever, (C) number of cases with shortness of dry cough

Forest plot of the effect of age on (A) number of cases with shortness of breath, (B) number of cases with fever, (C) number of cases with shortness of dry cough