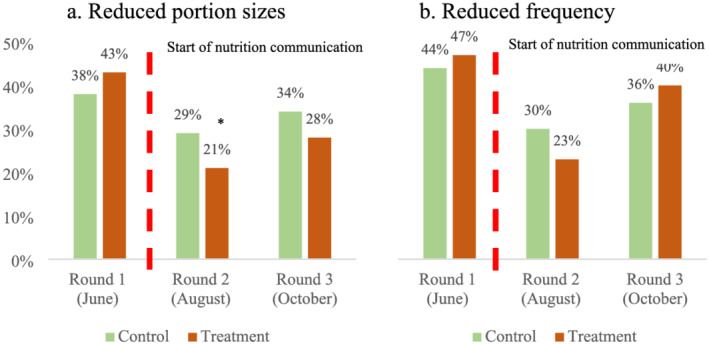
FIGURE 4.

Portion of sample households reporting reduced meat or fish consumption compared to a usual year (%). Source: IFPRI/MSR phone surveys (June, August and October 2020). Note: Meat or fish consumption pertains to the 7‐day period before the phone interview. Statistical significance of the difference between control and treatment households at the 1%, 5% and 10% levels is indicated with ***, ** and *, respectively
