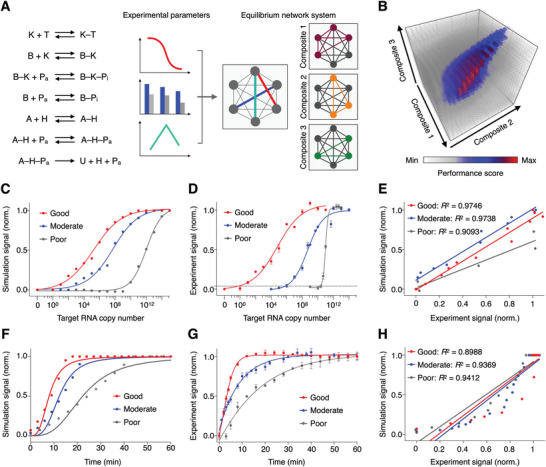
Figure 3.

Simulation‐based assay configuration. A) Computational model of the SCREEN network architecture. Using experimental equilibrium and kinetic properties measured of individual network reactions, we developed the model to simulate all reactions as chained equations to reflect and optimize coupling relationships between and among reactions. By component connectivity, the SCREEN system could be resolved as three major reaction composites. The model was performed with a varying amount of target, over a series of composite combinations, to optimize assay configuration for enhanced performance. B) Simulation result. Different assay configurations were simulated and presented as a performance score, which integrated key performance parameters, signals at high and low concentration of target, and speed to reach system equilibrium, using a weighted scoring system. C–E) The optimized assay configuration demonstrated enhanced signal. C) Simulated and D) experimental titration curves of representative good, moderate and poor performance assays as determined by the SCREEN model. The dotted line indicates the experimentally‐determined detection limit of the good performance assay configuration. The detection limit is defined as 3 × s.d. above the signal of the no‐target sample. Signals above this detection limit are considered distinguishable from the blank with >99% confidence. E) Correlation between experimental and simulated signals of the good, moderate and poor performance assays. F–H) The optimized assay configuration demonstrated enhanced kinetics. F) Simulated and G) experimental real‐time signal generated in response to target by representative good, moderate and poor performance assays as determined by the SCREEN model. H) Correlation between experimental and simulated signals of the good, moderate and poor performance assays. All experimental measurements were performed in triplicate and the data are presented as mean± s.d.
