
FIGURE 3.
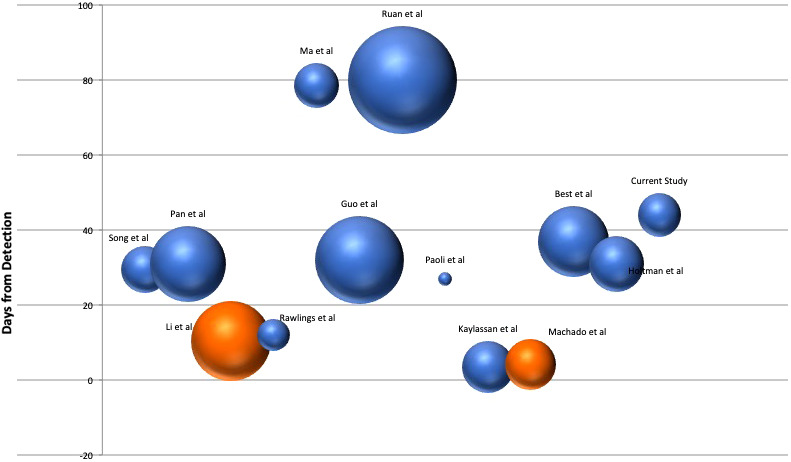
Bubble plot for the studies included in the review. The volume of the bubble reflects the number of patients included in the studies and plotted against the average number of days after which the semen sample was collected in patients diagnosed with COVID‐19 infection. The Orange Colored bubbles are the studies showing presence of SARS‐CoV‐2 in semen