
Figure 5.
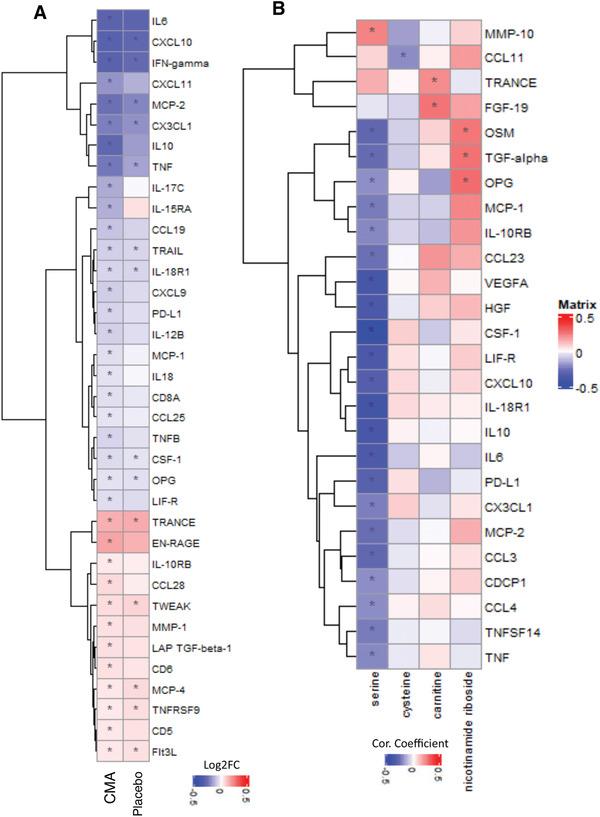
CMA affects the plasma level of inflammation related proteins. Association between inflammation related proteins that are significantly different between the CMA and placebo groups on Days 0 and Day 14 using the plasma samples obtained from 93 patients in Phase 2 clinical trial. A) Heatmap shows log2FC based alterations and clustering between significant proteins on Day 14 versus Day 0 in the CMA and placebo groups. Asterisks indicate statistical significance based on paired Student's t test. FDR value: < 0.01. B) Heatmap shows the correlation and clustering between the plasma level all inflammation related proteins and plasma levels of the individual constituents of CMA (including serine, carnitine, nicotinamide riboside, and cysteine). Asterisks indicate statistical significance based on Spearman correlation analysis. p value: < 0.05. Log2FC: log2(fold change).