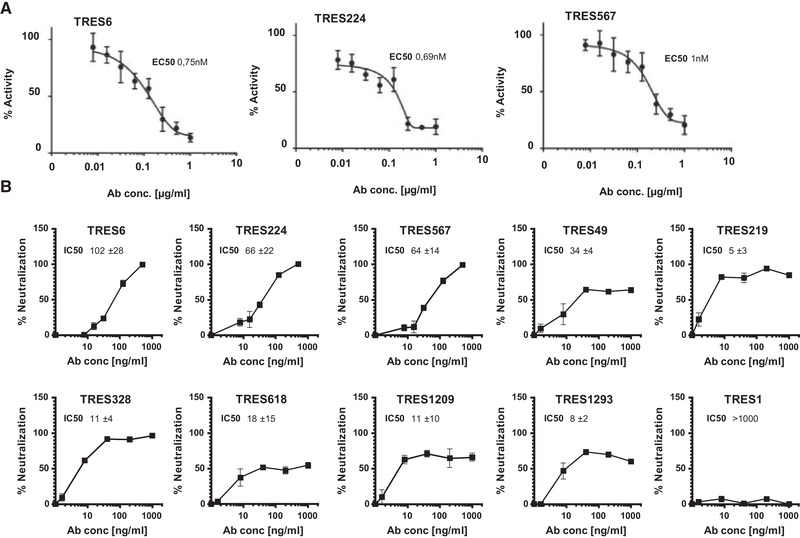
Figure 3.

Characterization of monoclonal TRES antibodies. (A) ELISA‐based hACE2‐competition assay with TRES antibodies. Plates were coated with RBD and incubated with serial dilutions of TRES antibodies and soluble hACE2 (400 ng/mL). Bound hACE2 was quantitated with HRP‐coupled antibodies against the hFcγ1‐Tag of hACE2. The mean and standard deviations of quadruplicates of one representative experiment out of two are shown in the graphs. The mean EC50s of all experiments are also shown. (B) Vero‐E6 cells were incubated with the CoV‐2 ER‐1 isolate with increasing concentrations of the respective TRES antibodies. SARS‐CoV‐2 infection after 20 to 24 h was quantitated as described in Fig. 1 F. Graphs show the mean and SEM of triplicates of one representative experiment of at least three experiments. The mean IC50 and standard deviations, in ng/mL, of all experiments are also given. IC50s were calculated with inhibitor versus variable slope fitting curve with GraphPad Prism 7.02.
